Office of Research blog: A look at cash-out refinance mortgages and their borrowers between 2013 to 2023
December 18, 2023 / Source: CFPB
By Alexei Alexandrov, Noah Cohen-Harding, and Patrick Lapid
As interest rates increased rapidly throughout 2022, the number of refinance mortgage originations declined. The composition of these refinances also changed. Cash-out refinances – where a homeowner borrows an amount substantially greater than what they owe on their existing mortgage – became more common than non-cash-out (also known as “rate-and-term”) refinances. An equity “cashed out” from the home – which, in turn, increases the mortgage balance – is often used by the borrower to pay down other debts, fund home repairs, and pay for educational expenses, among other big-ticket purchases. A cash-out refinance takes the place of the original mortgage, but alternative products that tap home equity, such as home equity loans and home equity lines of credit, leave the original first-lien mortgage intact. Such needs for cash may be necessary and unavoidable, hence the persistence of some (albeit reduced) amount of cash-out refinances even in the face of rising interest rates.
Despite the recent decrease in volume, cash-out refinance originations are a segment of the mortgage market worth monitoring, especially since they were considered one of the mechanisms that exacerbated the 2008 financial crisis.1 In the case of both cash-out and non-cash-out refinances, the borrower’s home is used as collateral for the loan. Failing to make payments or meet other loan conditions can result in the borrower losing their home through foreclosure. The added risk for borrowers originating a cash-out refinance, especially in today’s interest-rate environment, is that their mortgage payments and mortgage loan terms are both likely to increase.
Who are the homeowners taking out cash-out refinances, and are their loans comparable to non-cash-out refinance loans? Are cash-out refinance borrowers more likely to become delinquent? In this post, we look at the loan and borrower characteristics of homeowners who originated a cash-out refinance compared to a non-cash-out refinance. We study refinances originated between 2013 and 2023. This allows us to study delinquencies—one manifestation of risk—throughout the post-crisis period, and how they vary among the population. This period includes periods of falling and rising interest rates, as we have observed recently. With this information, we can better gauge the risk to consumers and the housing market of the recent trends in refinances. We find that:
- Cash-out refinances were a larger share of all refinances during periods of rising interest rates.
- Borrowers of cash-out refinances had lower credit scores, lower incomes, and smaller loan amounts compared to non-cash-out refinance borrowers.
- Loan-to-value and debt-to-income ratios were similar for cash-out and non-cash-out refinances.
- Cash-out refinances had larger shares of older, female, Black, and Hispanic borrowers, compared to non-cash-out refinances.
- Serious delinquencies were rare for borrowers with higher credit scores, regardless of whether the refinance was cash-out or not.
- For borrowers with lower credit scores, both cash-out and non-cash-out refinance borrowers have similar two-year delinquency rates, except for a relative increase in delinquencies among cash-out refinance borrowers in 2017—a year marked by rising interest rates.
We conclude with a comparison of the market for cash-out refinances before the financial crisis to the post-crisis time period, as well as potential concerns with cash-out refinances to monitor going forward.
Loan and borrower characteristics of refinances
We used refinance data in the National Mortgage Database to compare the loan characteristics and two-year delinquency status of cash-out refinances and non-cash-out refinances. The National Mortgage Database is a representative 1-in-20 sample of all closed-end first-lien mortgages in the United States. We identify refinances as cash-out refinance mortgages when the total value of sampled refinance loans and their associated junior liens were more than five percent larger than the total value of the preceding loans and associated junior liens.
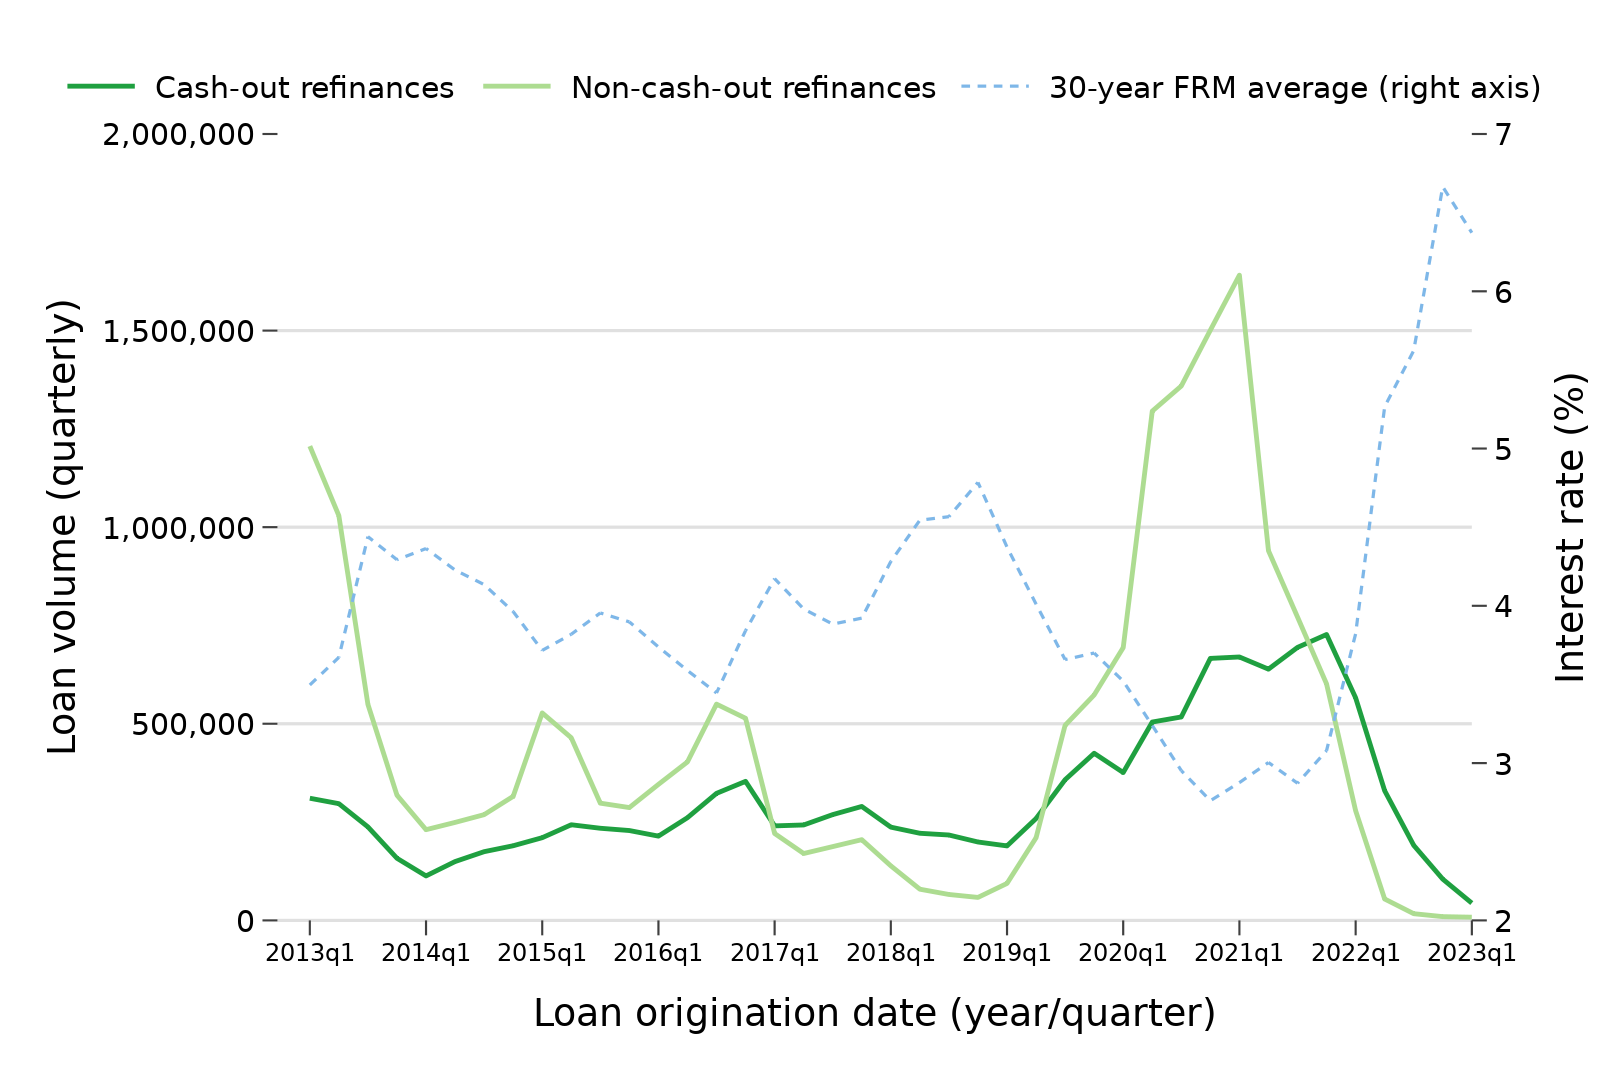
Figure 1 shows the quarterly volume of refinances, cash-out and non-cash-out, from the first quarter of 2013 through the first quarter of 2023 (the latest quarter for which we have data). We added the average interest rate on 30-year fixed-rate mortgages from Freddie Mac’s Primary Mortgage Market Survey on the right axis.
As Figure 1 indicates, non-cash-out refinances are typically more common when interest rates are decreasing and borrowers seek better rates compared to their original mortgages. Cash-out refinances make up a larger proportion of all refinances during periods when interest rates are increasing, such as 2017 to 2019 and 2022 to 2023. For example, from 2013 to 2019, cash-out refinances averaged about 240,000 originations per quarter, followed by an increase to almost 730,000 in the fourth quarter of 2021. Cash-out refinance volumes then fell throughout 2022, down to 44,000 originations in the first quarter of 2023.
Figure 1: Quarterly volume of cash-out versus non-cash-out refinances, 2013-2023
Source: National Mortgage Database
Figure 2 plots median credit scores by refinance type. The median credit scores of cash-out refinance borrowers were lower than non-cash-out refinance borrowers throughout the 2013-2023 period.
Figure 2: Median credit score at origination of cash-out versus non-cash-out refinances, 2013-2023
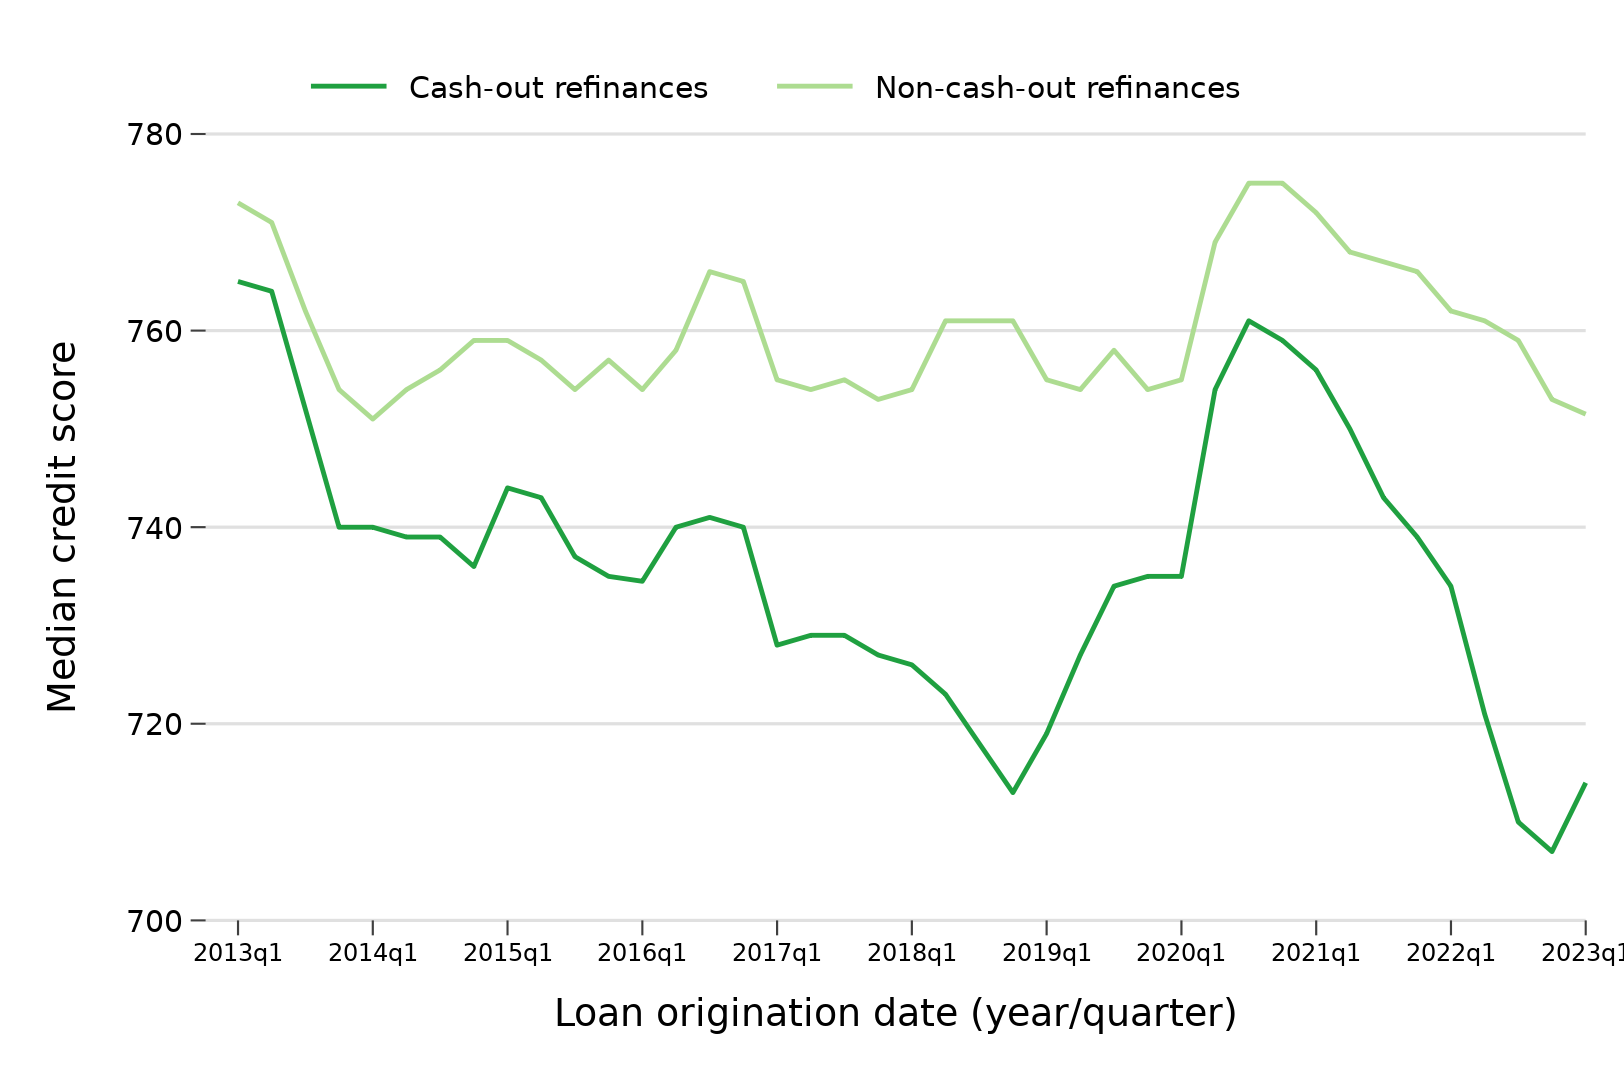
Source: National Mortgage Database
Figure 3 plots median combined loan-to-value ratios (100 percent less borrower equity in the house) by refinance type. The median combined loan-to-value ratios for cash-out refinances are generally similar to or lower than non-cash-out refinances originated in the same period, except during high interest-rate periods from 2017 to 2019 and 2022 to 2023, when median combined loan-to-value ratios for cash-out refinances are relatively higher than non-cash-out refinances.
Figure 3: Median combined loan-to-value ratio at origination of cash-out versus non-cash-out refinances, 2013-2023
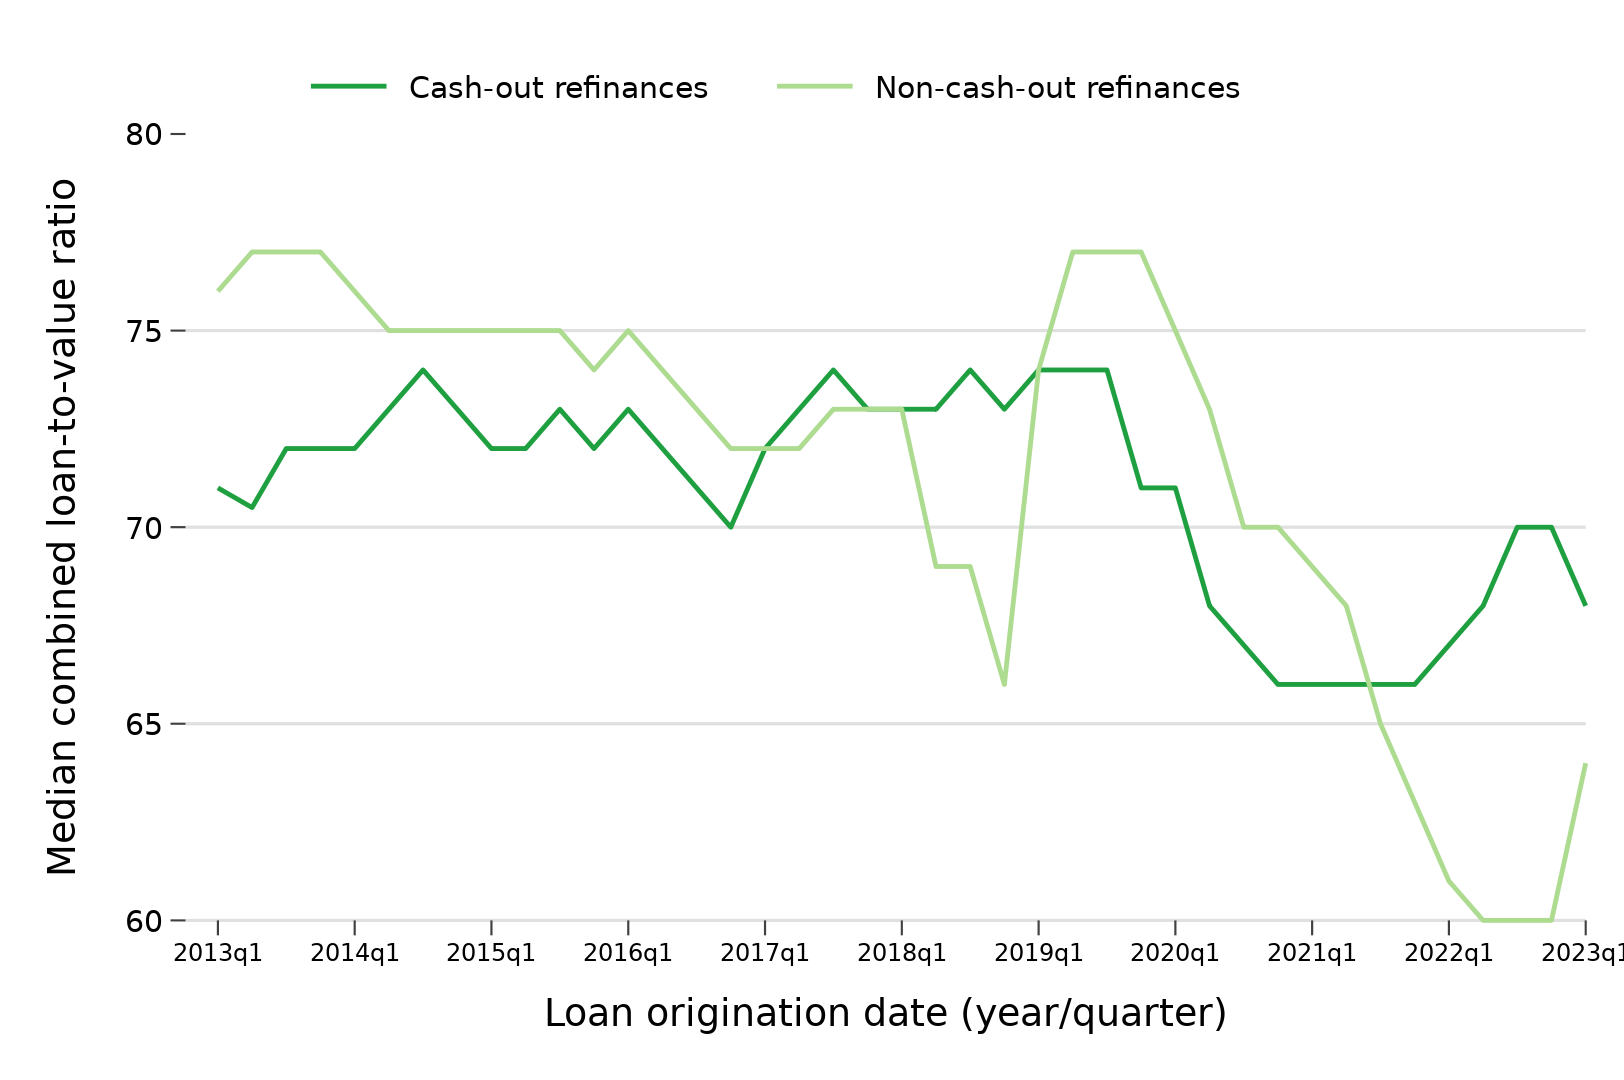
Source: National Mortgage Database
Table 1 describes other loan and borrower characteristics of cash-out and non-cash-out refinances originated between 2013 and 2023. We see that the median loan amount and borrower incomes for cash-out refinances were smaller than for non-cash-out refinances; the primary borrowers for cash-out refinances were older; and cash-out refinances were more likely to only have female borrowers and borrowers aged 62 and older. Cash-out refinance borrowers were also more likely to be Hispanic or Black and less likely to be Asian, compared to non-cash-out refinance borrowers.
Table 1: Loan and borrower characteristics by cash-out versus non-cash-out refinances
| Loan/borrower characteristics | Cash-out refinances | Non-cash-out refinances |
|---|---|---|
|
Loan amount (median) |
$198,000 |
$241,700 |
|
Cash-out amount (median) |
$37,131 |
N/A |
|
Interest rate (median) |
3.62% |
3.38% |
|
Combined loan-to-value ratio (median) |
70 |
72 |
|
Debt-to-income ratio (median) |
36 |
34 |
|
Borrower income (median) |
$84,000 |
$102,000 |
|
Credit score (median) |
741 |
765 |
|
Age of primary borrower (median) |
51 |
47 |
|
Share of refinances with only female borrowers (%) |
22.8 |
18.8 |
|
Share of refinances with only age 62 and older borrowers (%) |
21.1 |
15.0 |
|
Share of refinances with any Hispanic borrower (%) |
10.5 |
9.6 |
|
Share of refinances with any Black borrower (%) |
9.1 |
7.5 |
|
Share of refinances with any Asian borrower (%) |
4.7 |
9.8 |
|
Share of refinances with any American Indian borrower (%) |
0.7 |
0.5 |
|
Share of refinances with any Native Hawaiian/Pacific Islander borrower (%) |
0.7 |
0.8 |
|
Share of refinances with any borrower listing two or more races (%) |
1.9 |
1.7 |
|
Observations (N) |
641,657 |
957,748 |
Note: Sample includes refinance mortgages that were opened between the first quarter of 2013 and the first quarter of 2023. A cash-out refinance is identified when the total value of the sampled refinance loan and their associated junior liens was more than five percent larger than its preceding loan and associated junior liens. “Only female (or only age 62 and older) borrowers” means that for loans with only one borrower, that borrower is female (or age 62 and older), and for loans with multiple co-borrowers, that all co-borrowers are female (or age 62 and older). Source: National Mortgage Database.
Delinquencies of refinanced mortgages: the importance of borrowers’ credit scores
In terms of delinquencies at the two-year mark after their refinance loan origination, Figure 4 shows two-year delinquency rates of refinances, by year originated, from 2013 to 2020. We use a broad measure of delinquency: 60 or more days past due, including other adverse conditions such as bankruptcy and foreclosure. We also split the sample by credit score: refinances with a borrower credit score at or below the median credit score of 756 at origination (left panel) compared to refinances with a borrower credit score above the median (right panel).
Figure 4: Rates of serious delinquency (60+ days or worse) two years after origination for cash-out versus non-cash-out refinance borrowers
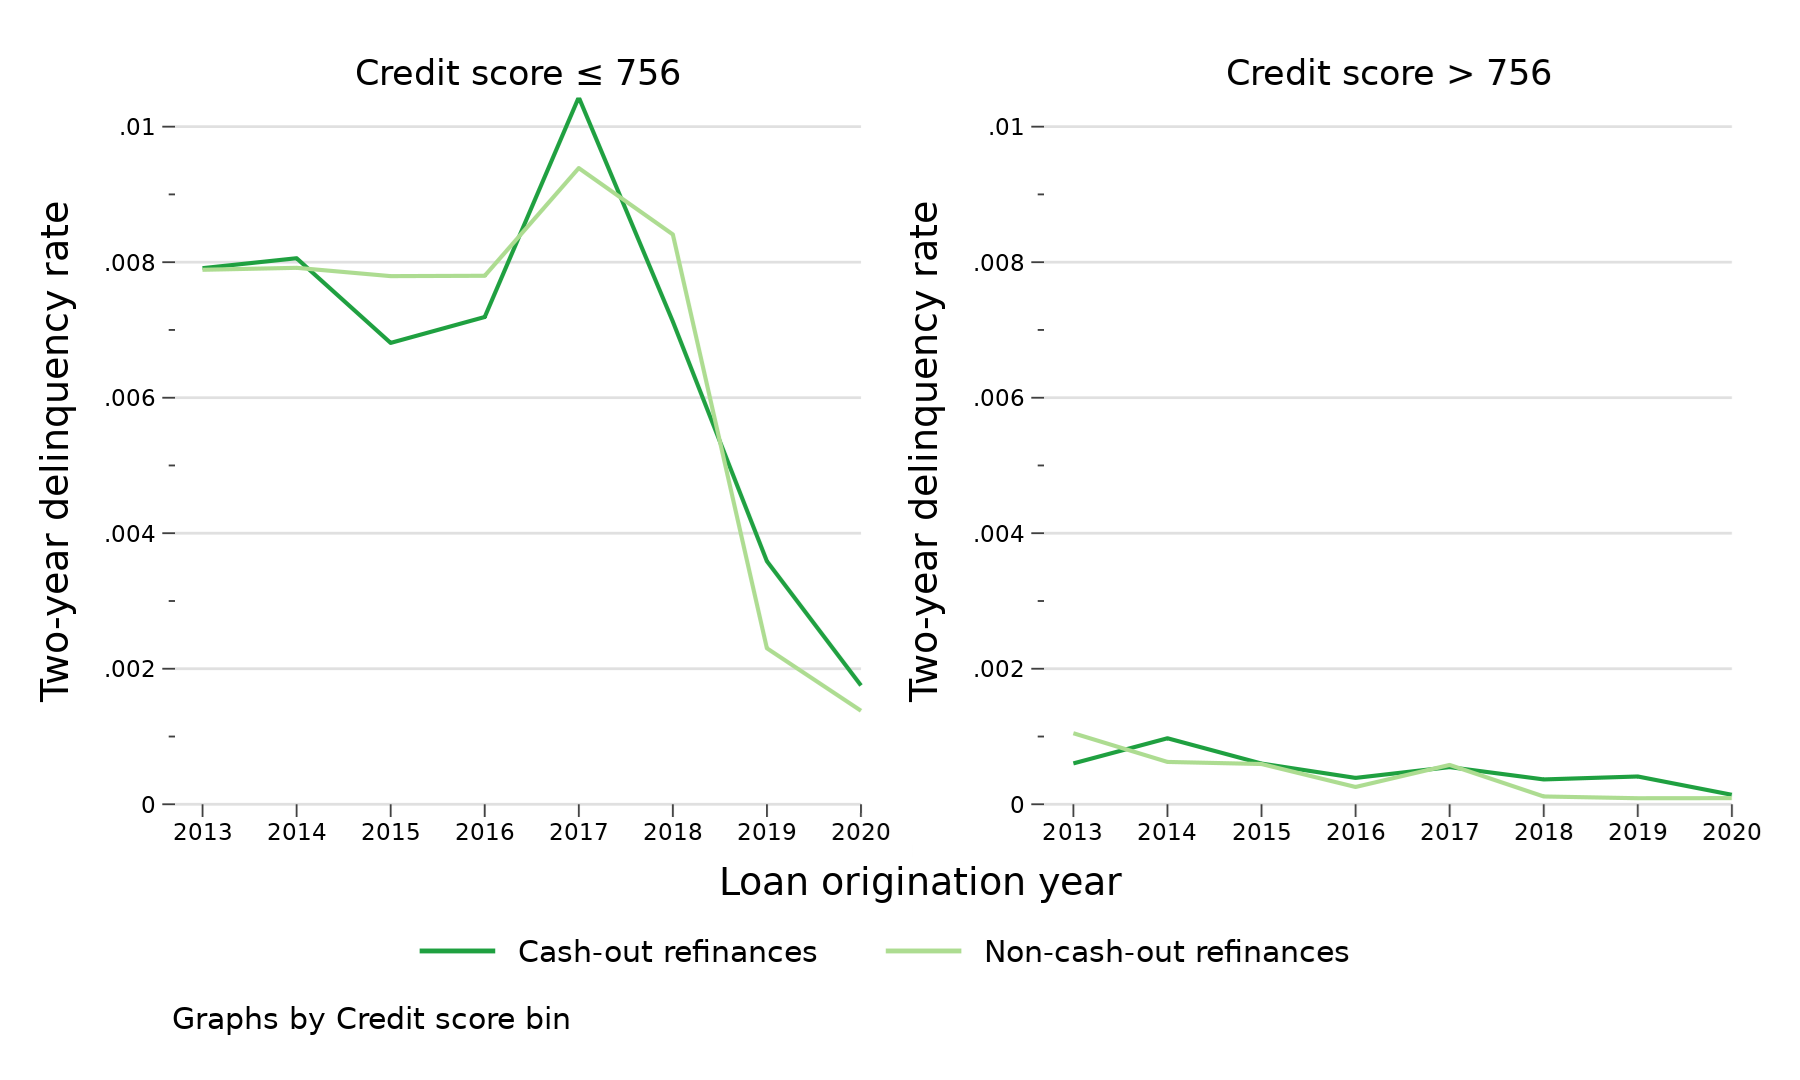
Source: National Mortgage Database.
We first see that serious delinquencies two years after origination are rare among both types of refinances involving borrowers with higher credit scores: no higher than 0.1 percent for originations between 2013 and 2020. By contrast, serious delinquencies are more likely among refinances involving borrowers with lower credit scores but are still uncommon in absolute terms: ranging between 0.7 and 0.8 percent for all refinances originated between 2013 and 2016, followed by an increase in 2017 to 1 percent for cash-out refinances and 0.9 percent for non-cash out refinances.2 Two-year delinquency rates then fall among all refinances with lower credit scores originated after 2018, likely due to mortgage forbearance programs in the Coronavirus Aid, Relief, and Economic Security (CARES) Act.
Worth noting is the increase in two-year delinquency rates for cash-out refinances originated in 2017. We know that these borrowers refinanced at a time when interest rates were rising (see Figure 1), and that credit scores were lower overall for cash-out borrowers in 2017 compared to previous years (see Figure 2). These findings from 2017 suggest that we may see increased delinquencies among cash-out refinance mortgages originated in 2022, another period with an increase in interest rates and a decrease in cash-out borrowers’ credit scores.
Discussion and potential concerns with cash-out refinances
In summary, during periods of rising interest rates, refinance volume declines and their composition shifts toward cash-out refinances, since homeowners may need cash from their home even when interest rates increase. From the first quarter of 2013 to the first quarter of 2023, cash-out refinances tended to have smaller loan amounts, lower borrower incomes, and lower borrower credit scores compared to non-cash-out refinances, but other loan characteristics, such as loan-to-value and debt-to-income ratios, were similar. We then showed that two-year delinquency rates were similar between both types of refinances, with only a noticeable increase for lower credit-score borrowers taking out cash-out refinances in 2017.
Prior research has focused on cash-out refinances as one of the mechanisms that exacerbated the 2008 financial crisis. However, mortgage originations from 2013 to 2023 are fundamentally different from mortgage underwriting before the financial crisis. Many risky features are now absent from the market – for example, interest-only mortgages, negative amortization mortgages, and mortgages with loan-to-value ratios over 100 percent – and lenders are now required to document borrowers’ ability to repay their loans. As we have shown above, most cash-out refinances now have loan-to-value ratios below 80 percent, requiring a 20 percent or more drop in house prices to be underwater. Most cash-out amounts are also below $50,000 during this period, and the volume of cash-out refinances has been declining each quarter since the start of 2022. Although cash-out refinances gained popularity from 2019 to 2021 due to record-low interest rates , the amount of equity extracted was lower than during the pre-2008 boom, despite home prices having increased substantially. These characteristics of cash-out refinances over the past decade suggest that cash-out refinances are now a smaller source of systemic risk than before the 2008 financial crisis.
Beyond the potential systemic risk of equity extraction contributing to a new financial crisis, cash-out refinances present at least two other concerns for borrowers. First, research from the JPMorgan Chase Institute showed that a typical cash-out refinance in their data had a longer loan term and larger monthly payment compared to the paid-off mortgage. This suggests that cash-out borrowers are more likely to still be paying off their mortgage and less likely to own their home free and clear in retirement, potentially exposing these borrowers to more future financial shocks while the mortgage is outstanding. Second, a cash-out refinance with a higher interest rate than the prior paid-off mortgage could effectively lead to much higher borrowing costs, relative to the original mortgage or to other sources of credit, like home equity loans or home equity lines of credit, that do not raise the interest rate on the existing first-lien loan balance.3 Prior research has shown that higher interest rates can cause delinquency and default.4 This relationship highlights the importance for borrowers of finding and obtaining lower interest-rate loans, and aligns with efforts to help borrowers refinance when interest rates fall as a way to avoid delinquencies.
As the interest-rate environment continues to evolve, the CFPB’s Office of Research will continue analyzing mortgage refinances and other home equity loan products to understand consumers’ borrowing decisions and loan performance.
Footnotes
- See, e.g., Mian, Atif, and Amir Sufi. 2014. House of Debt : How They (and You) Caused the Great Recession, and How We Can Prevent It from Happening Again . Chicago: University of Chicago Press. See also Khandani, Amir E., Andrew W. Lo, and Robert C. Merton. 2013. “Systemic risk and the refinancing ratchet effect.” Journal of Financial Economics 108, no. 1: 29-45. https://doi.org/10.1016/j.jfineco.2012.10.007 .
- For comparison, the national average of all mortgages 90 or more days delinquent was 2.1 percent in January 2015. It fell to 0.9 percent in January 2020 and was 0.5 percent as of January 2023. See https://www.consumerfinance.gov/data-research/mortgage-performance-trends/mortgages-90-or-more-days-delinquent/.
- Joint work by researchers at the American Enterprise Institute and the Center for Responsible Lending note that cash-out refinance borrowers currently pay a very high effective interest rate for equity extraction, even if it is used to cover a higher-interest debt.
- See, e.g., Gupta, Arpit. 2019. “Foreclosure contagion and the neighborhood spillover effects of mortgage defaults.” The Journal of Finance 74, no. 5: 2249-2301. https://doi.org/10.1111/jofi.12821 . See also Scharlemann, Therese C., and Stephen H. Shore. 2022. “The effect of changing mortgage payments on default and prepayment: Evidence from HAMP resets.” Real Estate Economics 50, no. 5: 1231-1256. https://doi.org/10.1111/1540-6229.12377 .