Racial Differences in Economic Security: Non-Housing Assets
January 10, 2023 / Source: Treasury
This is the fourth installment in a series of blog posts on racial inequality produced by the Office of Economic Policy. The other posts can be found at these links: 1. Racial Inequality in the United States, 2. Racial Differences in Economic Security: The Racial Wealth Gap, 3. Racial Differences in Economic Security: Housing
In this post, we discuss racial differences in the ownership and value of non-housing assets including financial investments, defined contribution retirement accounts, and cash and cash equivalents. These wealth categories are important contributors to the racial wealth gap and other differences in economic security across racial and ethnic groups.[1] In this post, we focus on the non-income determinants of these asset disparities. Racial disparities in the ownership and value of non-housing assets are also attributable to differences in household income, which we will explore in a future post.
FINANCIAL INVESTMENTS
Non-retirement financial investments, such as stocks, bonds, and mutual funds, have historically been an effective way to build wealth over the long run given the high returns on these assets that increase substantially over time due to the power of compounding. However, ownership rates of financial investments are significantly lower for Black and Hispanic households than for white households, even within the same income quartile (see Figure 1).[2] In the bottom two income quartiles, rates of ownership are over five times larger among white households than among Black and Hispanic households. In the third and fourth quartiles, respectively, rates of ownership for white households are 24 percent and 43 percent, respectively, compared to 14 percent and 32 percent for Black households and just 4 percent and 22 percent for Hispanic households.
Among households with any financial investments, the value of these Black- and Hispanic-owned assets are significantly less than the value of those owned by white households no matter the income group (see Figure 2). For example, in 2019 the value of financial investments for the typical white household in the third income quartile (households with incomes between $59,000 and $108,000) was $35,000 compared to just $12,000 and $3,300 for the typical Black and Hispanic households, respectively.
Figure 1. Racial Differences in Rates of Financial Investment Ownership

Notes: Figure displays rates of non-retirement directly held stock, bond, and mutual fund ownership by race/ethnicity and income quartile. Other includes people who are Asian, Native Hawaiian or Pacific Islander, American Indian and Alaska Native, or any other race and not of Hispanic ethnicity. Household income quartiles correspond to the following ranges (in 2019 dollars): $0-$30,500; $30,500-$59,000; $59,000-$108,000; $108,000 and above.
Source: Treasury calculations using data from the 2019 Survey of Consumer Finances.
Figure 2. Racial Differences in Median Values of Financial Investments

Notes: Figure displays median values of non-retirement directly held stocks, bonds, and mutual funds by race/ethnicity and income quartile in 2019 dollars. See Figure 1 notes for a description of racial and ethnic groups and income quartile values.
Source: Treasury calculations using data from the 2019 Survey of Consumer Finances.
There are several determinants of racial gaps in financial investment ownership. As mentioned, income differences across racial and ethnic groups are a key contributor to aggregate differentials, but, as shown above, disparities in equity ownership and wealth exist within the same income quartile. Differences in intergenerational wealth transfers, as discussed in our prior post on the racial wealth gap, may also play a role, since parents who own these assets may bequest them to their children who accrue significant tax benefits, and households that receive more money from family have more to invest, all else equal. In 2019, 30 percent of white households reported receiving an inheritance, gift, or other financial support from family compared to just 10 percent, 7 percent, and 18 percent for Black, Hispanic, and other race households, respectively. Furthermore, conditional on receiving any intergenerational support, the amount received by white households tends to be larger than the amount received by households of other races and ethnic groups.[3]
Differences in risk preferences across racial and ethnic groups may also contribute to differences in financial investments, which can be riskier than investing in housing or keeping cash in a savings account. Between 2013 and 2016, 23 percent of white households aged 35 to 59 reported being willing to take at least “above average” financial risk compared to just 17 percent of Black and 14 percent of Hispanic households.[4] In addition, the racial composition of the finance profession may be a contributing factor. In 2022, 83 percent of certified financial planners are white whereas only 2 percent and 3 percent are Black and Hispanic, respectively.[5]
Finally, there is evidence that, after controlling for economic and demographic characteristics, young families whose parents owned stock are more likely to own stock themselves.[6] The differences in intergenerational wealth transfers by race and ethnicity described above may enable some children to disproportionately invest in stocks as adults because they have more resources with which to make those investments. The parent-child correlation in stock ownership may also exist because the children of stockowners are more aware of different investment options than children of non-stockowners, given the relatively high information costs associated with acquiring new assets.
Racial gaps in financial investments contribute to the persistence of racial disparities in economic security. Because of the differences in equity holdings, Black and Hispanic households have benefitted less from the wealth-generating opportunities that these investments provide. Moreover, there is evidence that the gaps in non-retirement equity ownership have contributed to the widening of the racial wealth gap in recent decades because stock equity has appreciated at a higher rate than more widely held assets like housing.[7]
RETIREMENT WEALTH
Racial differences in economic security are also attributable to differences in retirement accounts. There are several types of retirement accounts, including defined contribution plans, which are tax-preferred accounts that may or may not be tied an employer, and employer-sponsored defined benefit plans. Defined contribution plans, such as 401(k)s or individual retirement accounts, accumulate value based on contributions made by individuals or employers and the returns on those contributions over time. In contrast, defined benefit plans provide a payment in retirement that is not directly linked to contribution amounts or market returns; for example, using a formula based on the employee’s average salary and years of service. While all plans contribute to economic security in retirement, the risks and benefits of each type of plan differ, including the ability to borrow against the account, which is much more common for defined contribution than defined benefit plans. This post focuses on defined contribution accounts only since data on defined benefit wealth is scarce, in part because the value of defined benefit plan wealth is difficult to determine prior to retirement.[8]
White households are more likely to own defined contribution retirement accounts than Black or Hispanic households in every income quartile (see Figure 3). In addition, ownership gaps exist across the lifecycle: among households aged 35 to 54, who have the highest rates of defined contribution retirement account ownership, 65 percent of white families have at least one account compared to just 44 and 28 percent of Black and Hispanic families, respectively.[9]
As with non-retirement financial investments, the value of defined contribution retirement account assets held by the typical white household are larger than those held by households of other races and by Hispanic households, no matter the income quartile (see Figure 4). For example, in the third income quartile, the typical white household has $53,000 in defined contribution retirement account wealth compared to $41,000 and $25,000 for the typical Black and Hispanic households, respectively.
Figure 3. Racial Differences in Rates of Defined Contribution Retirement Account Ownership

Notes: Figure displays rates of defined contribution retirement account ownership by race/ethnicity and income quartile in 2019 dollars. See Figure 1 notes for a description of racial and ethnic groups and income quartile values.
Source: Treasury calculations using data from the 2019 Survey of Consumer Finances.
Figure 4. Racial Differences in Median Values of Defined Contribution Retirement Account Wealth
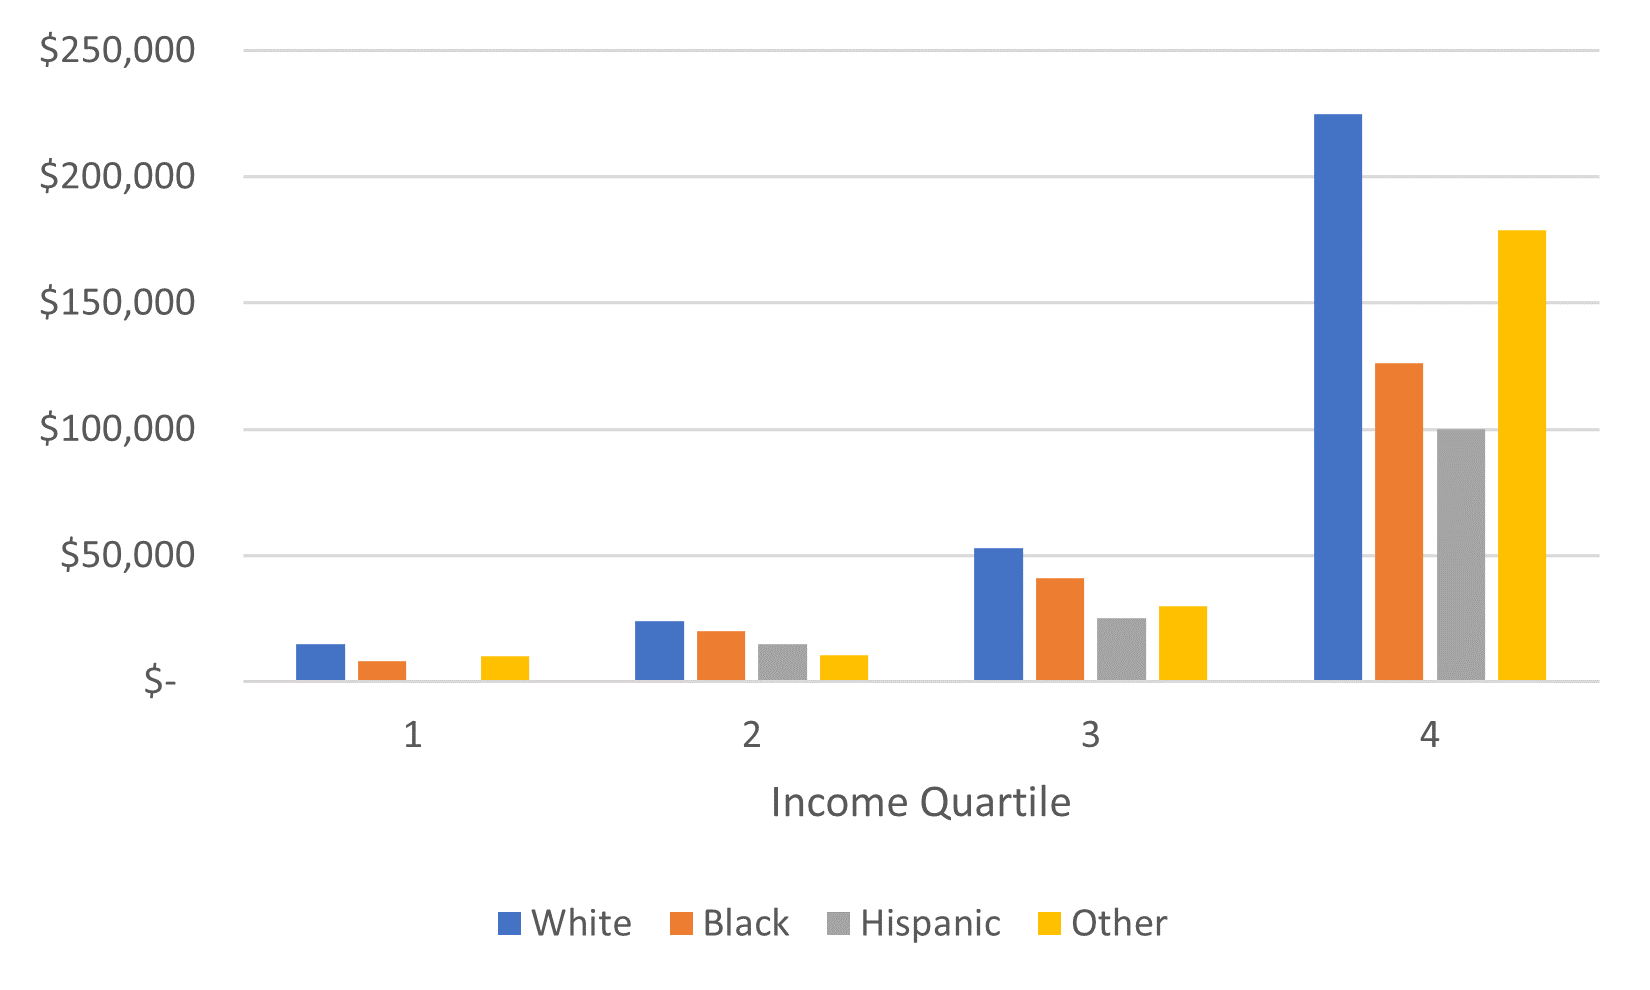
Notes: Figure displays median values of defined contribution retirement accounts by race/ethnicity and income quartile in 2019 dollars. See Figure 1 notes for a description of racial and ethnic groups and income quartile values.
Source: Treasury calculations using data from the 2019 Survey of Consumer Finances.
These gaps in retirement account ownership are driven in part by unequal access to retirement plans across racial and ethnic groups. For every six white households with access to an employer-sponsored retirement plan, only five Black and four Hispanic households have access.[10] Racial disparities in access to and the amount of wealth held in defined contribution retirement accounts are due, in part, to differences in labor market outcomes, including differences in place and type of employment and differences in earnings, which we will discuss in a future blog post.
Racial gaps in retirement account ownership are also attributable to language and information barriers. Targeted policies that make retirement plans more accessible and understandable may help overcome these barriers. For example, an intervention that provided low- and moderate-income, Spanish-speaking Hispanic individuals with information about financial planning for retirement in Spanish increased participation in a government-sponsored retirement account by 12 percent.[11] Another study found that automatic enrollment equalizes 401(k) participation rates across races and ethnic groups, by generating larger increases in enrollment among Black and Hispanic individuals who previously had lower participation rates.[12]
Racial gaps in retirement account ownership and wealth have implications beyond their impact on the ability to consume in retirement. First, these wealth gaps mean that Black and Hispanic households are less likely to enjoy the tax benefits that accompany retirement plan participation. Second, the ability to withdraw funds from retirement accounts (in some cases with a fee) can be a source of financial stability for households in times of economic distress, so households that lack these assets may have less of a financial buffer in times of hardship, all else equal. Finally, these gaps may exacerbate wealth gaps among the next generation if households with less retirement wealth disproportionately rely on their family for support in retirement or have less wealth to pass to family members at the end of life.
CASH AND CASH EQUIVALENTS
Cash and cash equivalents, like money in checking or savings accounts, can be more important for weathering financial shocks than the less liquid assets previously discussed since they are more accessible to households in unexpected times of need. Therefore, although cash and cash equivalents make up only 4 percent of household wealth for the median household,[13] they can have a disproportionate impact on spending behavior, especially in times of hardship.
The typical white household has nearly four times the amount of cash than the typical Black or Hispanic household,[14] and racial disparities exist in every income quartile (see Figure 5). The typical white household in the third income quartile has $8,400 in cash compared to the typical Black and Hispanic households, who have just $4,200 and $4,000, respectively.
Figure 5. Racial Differences in Cash and Cash Equivalents

Notes: Figure displays median values of cash and cash equivalents, defined as money in all types of transactions accounts. See Figure 1 notes for a description of racial and ethnic groups and income quartile values.
Source: Treasury calculations using data from the 2019 Survey of Consumer Finances.
The determinants of the disparities in cash and cash equivalents are the differences in the same fundamentals already mentioned: overall wealth, income, and intergenerational transfers. These disparities render Black and Hispanic households more vulnerable to negative income shocks than white households. A recent study suggests that the consumption of Black and Hispanic households is 45 percent and 20 percent more sensitive, respectively, to income shocks than the consumption of white households and that these differences can be completely explained statistically by differences in liquid assets.[15] In addition, cash disparities may make it more likely that Black and Hispanic households will need to take on costly debt like payday loans[16] or potentially pay fees to draw early from retirement accounts in the event of an income shock, medical emergency, or other unplanned expense.
SUMMARY
The disparities in non-housing asset holdings across race and ethnicity are stark and are tied to longstanding disparities in income, intergenerational transfers, and employment-based savings. More research is needed on other determinants of these disparities and on policies that may be helpful to address them. Promising work on interventions such as the use of automatic enrollment or community-targeted information exchanges sheds light on possible paths forward. Further action is essential since differences in non-housing assets contribute to stark gaps in wealth, economic security, and well-being across race and ethnicity. As such, it will be difficult to achieve greater economic equity across races in general without more equality in these asset categories.