Office of Research blog: Higher interest rates leading to higher debt burdens for mortgage borrowers
November 30, 2022 / Source: CFPB
Mortgage interest rates rose sharply over recent months. While we’re beginning to see the impact of these changes on borrowers and potential homebuyers, fresh data can provide valuable and timely insights into the risks and trends in the overall mortgage markets that would otherwise not be available until later time.
In accordance with the 2015 HMDA Rule, a financial institution is required to report quarterly HMDA data if it reported a combined total of at least 60,000 covered loans and applications, excluding purchased covered loans, for the preceding calendar year. This data is beginning to reveal the impact of rising interest rates on borrowers’ monthly payments and overall debt burdens, as well as the impact of increasing rates of debt on potential homebuyers’ ability to qualify for a mortgage loan.
Quarterly HMDA data
In 2022, 55 financial institutions reported their mortgage activities for the first and second quarters.1 Even though the number of quarterly filers is small – 55 quarterly filers in 2022 compared to a total of 4,338 annual filers reporting HMDA data in 2021 – these reporters comprise the largest lenders, accounting for about 54.8 percent of all applications and 51.5 percent of all originations reported in 2021 HMDA data.
For this post, we combine the quarterly data of these 55 reporters in the first half of 2022 with their annual data from past years. We limit the analyses to closed-end home-purchase loans secured by site-built, single-family, and first-lien principal residence. Reverse mortgage loans have been excluded from this analysis.
The significant rise of monthly mortgage payments in 2022
The green line (corresponding to left axis) in Figure 1 plots the monthly average interest rates for 30-year fixed-rate closed-end conventional conforming loans originated to the prime borrowers secured by first-lien principal residence. As the figure shows, after two years of decline, the mortgage interest rate began rising in 2021 and really took off in 2022. This pattern generally aligns with Freddie Mac’s Primary Mortgage Market Survey , which covers first-lien prime conventional conforming home purchase mortgages with a loan-to-value of 80 percent.
One direct consequence of higher interest rates is the higher monthly payments borne by borrowers. Even though monthly payment information is not reported in HMDA data, using the reported loan amount, loan term and interest rate, we can impute the monthly principal and interest payment of loans at origination. This does not include taxes and insurance, which also factors into the borrower’s total monthly payment. The thicker orange line (corresponding to right axis) in Figure 1 illustrates the sharp rise of monthly mortgage payment amounts since the beginning of 2022. While the average monthly payment excluding taxes and insurance for borrowers taking out a conventional conforming 30-year fixed-rate mortgage was mostly stable throughout 2018 to 2020, it started to rise in 2021 and shot up in the first half of 2022, from $1,446 in December 2021 to $1,974 in June 2022 – a 36.5 percent increase in a span of six months. This increase was driven almost entirely by the rise in mortgage interest rates, as the average loan amount only increased by a very modest 1.1 percent from December 2021 to June 2021, while the average interest rate increased from 3.30 to 5.26 percent.
This increase in monthly payment amounts was felt across all racial and ethnic groups. While not shown on the graph, over the same period, the average monthly payment for 30-year fixed-rate conventional conforming mortgages rose by about 36.9 percent for Black borrowers, 36.7 percent for Hispanic white borrowers, 37.7 percent for non-Hispanic white borrowers, and 32.3 percent for Asian borrowers.
Figure 1: Average prime interest rate and monthly mortgage payment for 30-year fixed-rate conventional conforming mortgages
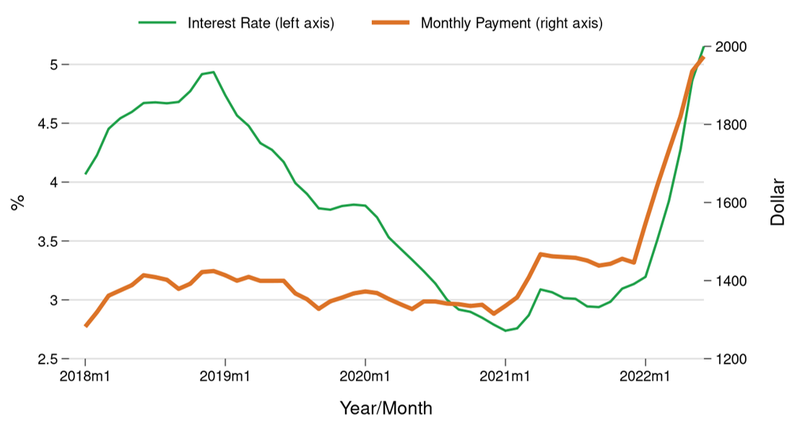
The chart represents newly originated home-purchase closed-end loans secured by site-built single-family first-lien principal residence, excluding reverse mortgages. Prime borrowers are defined as those with a credit score of at least 720 and CLTV of around 80 percent (79 percent ≤ CLTV ≤ 80 percent).
Hispanic white and Black borrowers reach new debt burden levels
One important measurement of a consumer’s total debt burden is their debt-to-income ratio (DTI), which is calculated by dividing the applicant’s or borrower’s total monthly debt – including mortgage payments or housing expenses, plus other debts such as credit card debts and car loans – by their gross income. A higher DTI means that the consumer has more debt obligations relative to their income, which could put them in a more precarious financial position if they experience a financial shock or emergency.
Figure 2 plots the average DTI for 30-year fixed-rate conventional conforming home purchase loans by race and ethnicity. Overall, the average DTI declined between the end of 2018 and beginning of 2021, given the historical decline of mortgage interest rates taking place over the same period.
The trend has reversed since the beginning of 2021. Average DTI rose significantly for all groups and were nearly back to or slightly exceeded their 2018 levels by June 2022. In particular, by the end of our observation period, the average DTI for Hispanic white borrowers reached over 40 percent, while the average DTI for Black borrowers rose to 39.4 percent. Although we don’t have third quarter filings for 2022 HMDA data at this time, given the trends observed in the first half of the year and the fact that the mortgage interest rates continued to rise in the third and fourth quarters of 2022 to the highest level in more than 20 years, we predict that the increase in DTI will likely continue through the rest of 2022. This means that consumers taking out new mortgages are likely devoting a higher share of their income towards servicing debts, especially mortgage payments, with the potential that average DTI for Hispanic white and Black borrowers will approach levels not seen since DTI information was first collected in HMDA in 2018.
Figure 2: Average debt-to-income ratio (DTI) for 30-year fixed-rate conventional conforming mortgages, by race and ethnicity
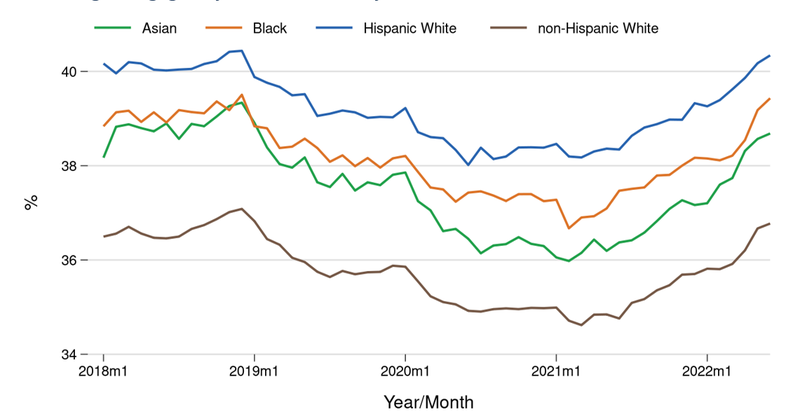
The chart represents newly originated home-purchase closed-end loans secured by site-built single-family first-lien principal residence, excluding reverse mortgages.
Higher DTI levels increasingly factor into denials for minority borrowers
Rising interest rates could also affect whether consumers qualify for mortgage loans. For many mortgage applicants who are on the margin of qualifying, the higher projected DTI could potentially lead to their applications being rejected, when they would have otherwise been approved if they had a lower DTI. So far, in the HMDA quarterly filing data, we have not observed a significant increase in the denial rates of mortgage applications for home purchase loans distinguishable from noises and seasonal variation. However, one telltale sign of the impact of higher mortgage interest rates comes in the form of reported reasons for denials. Figure 3 plots among the home purchase mortgage applications that were denied, the percentages of those that reported “debt-to-income ratio” as the principal reason or one of the reasons for denial. Compared to 2021, DTI has become more likely to be reported as a denial reason for denied Black, Hispanic white and non-Hispanic white applications in 2022. Notably, by the end of the second quarter of 2022, over 45 percent of all Black and Hispanic white applicants who were denied had DTI reported as a denial reason. That is the highest since the revised HMDA data collection and reporting requirements took effect in 2018. Whether this represents a trend into the rest of 2022 remains to be seen and is one indicator we should keep watchful eyes on as additional HMDA data arrive.
Figure 3: Percentage of denials with DTI reported as reason
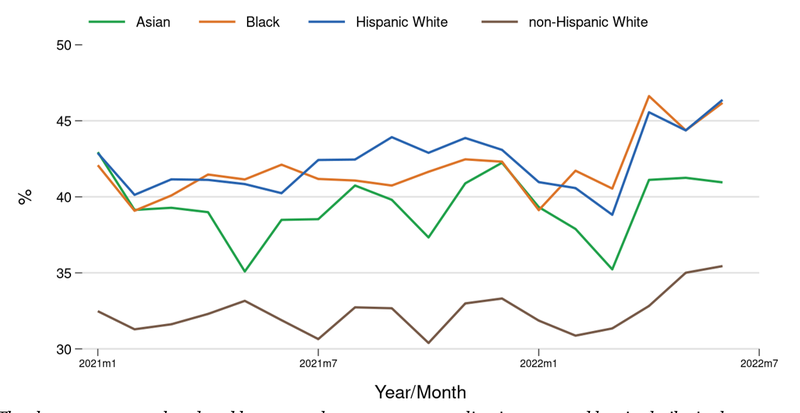
The chart represents closed-end home-purchase mortgage applications secured by site-built single-family first-lien principal residence, excluding reverse mortgages.
The views expressed here are those of the author and do not necessarily reflect the views of the Consumer Financial Protection Bureau. Links or citations in this post do not constitute an endorsement by the Bureau.
1. Quarterly HMDA filers must report their quarterly data within 60 calendar days after the end of each calendar quarter except the fourth quarter, when annual filings are reported in lieu of quarterly filings.