Unpacking the Boom in U.S. Construction of Manufacturing Facilities
July 27, 2023 / Source: Treasury
Eric Van Nostrand, Acting Assistant Secretary for Economic Policy
Tara Sinclair, Deputy Assistant Secretary for Macroeconomics
Samarth Gupta, Special Assistant for Economic Policy
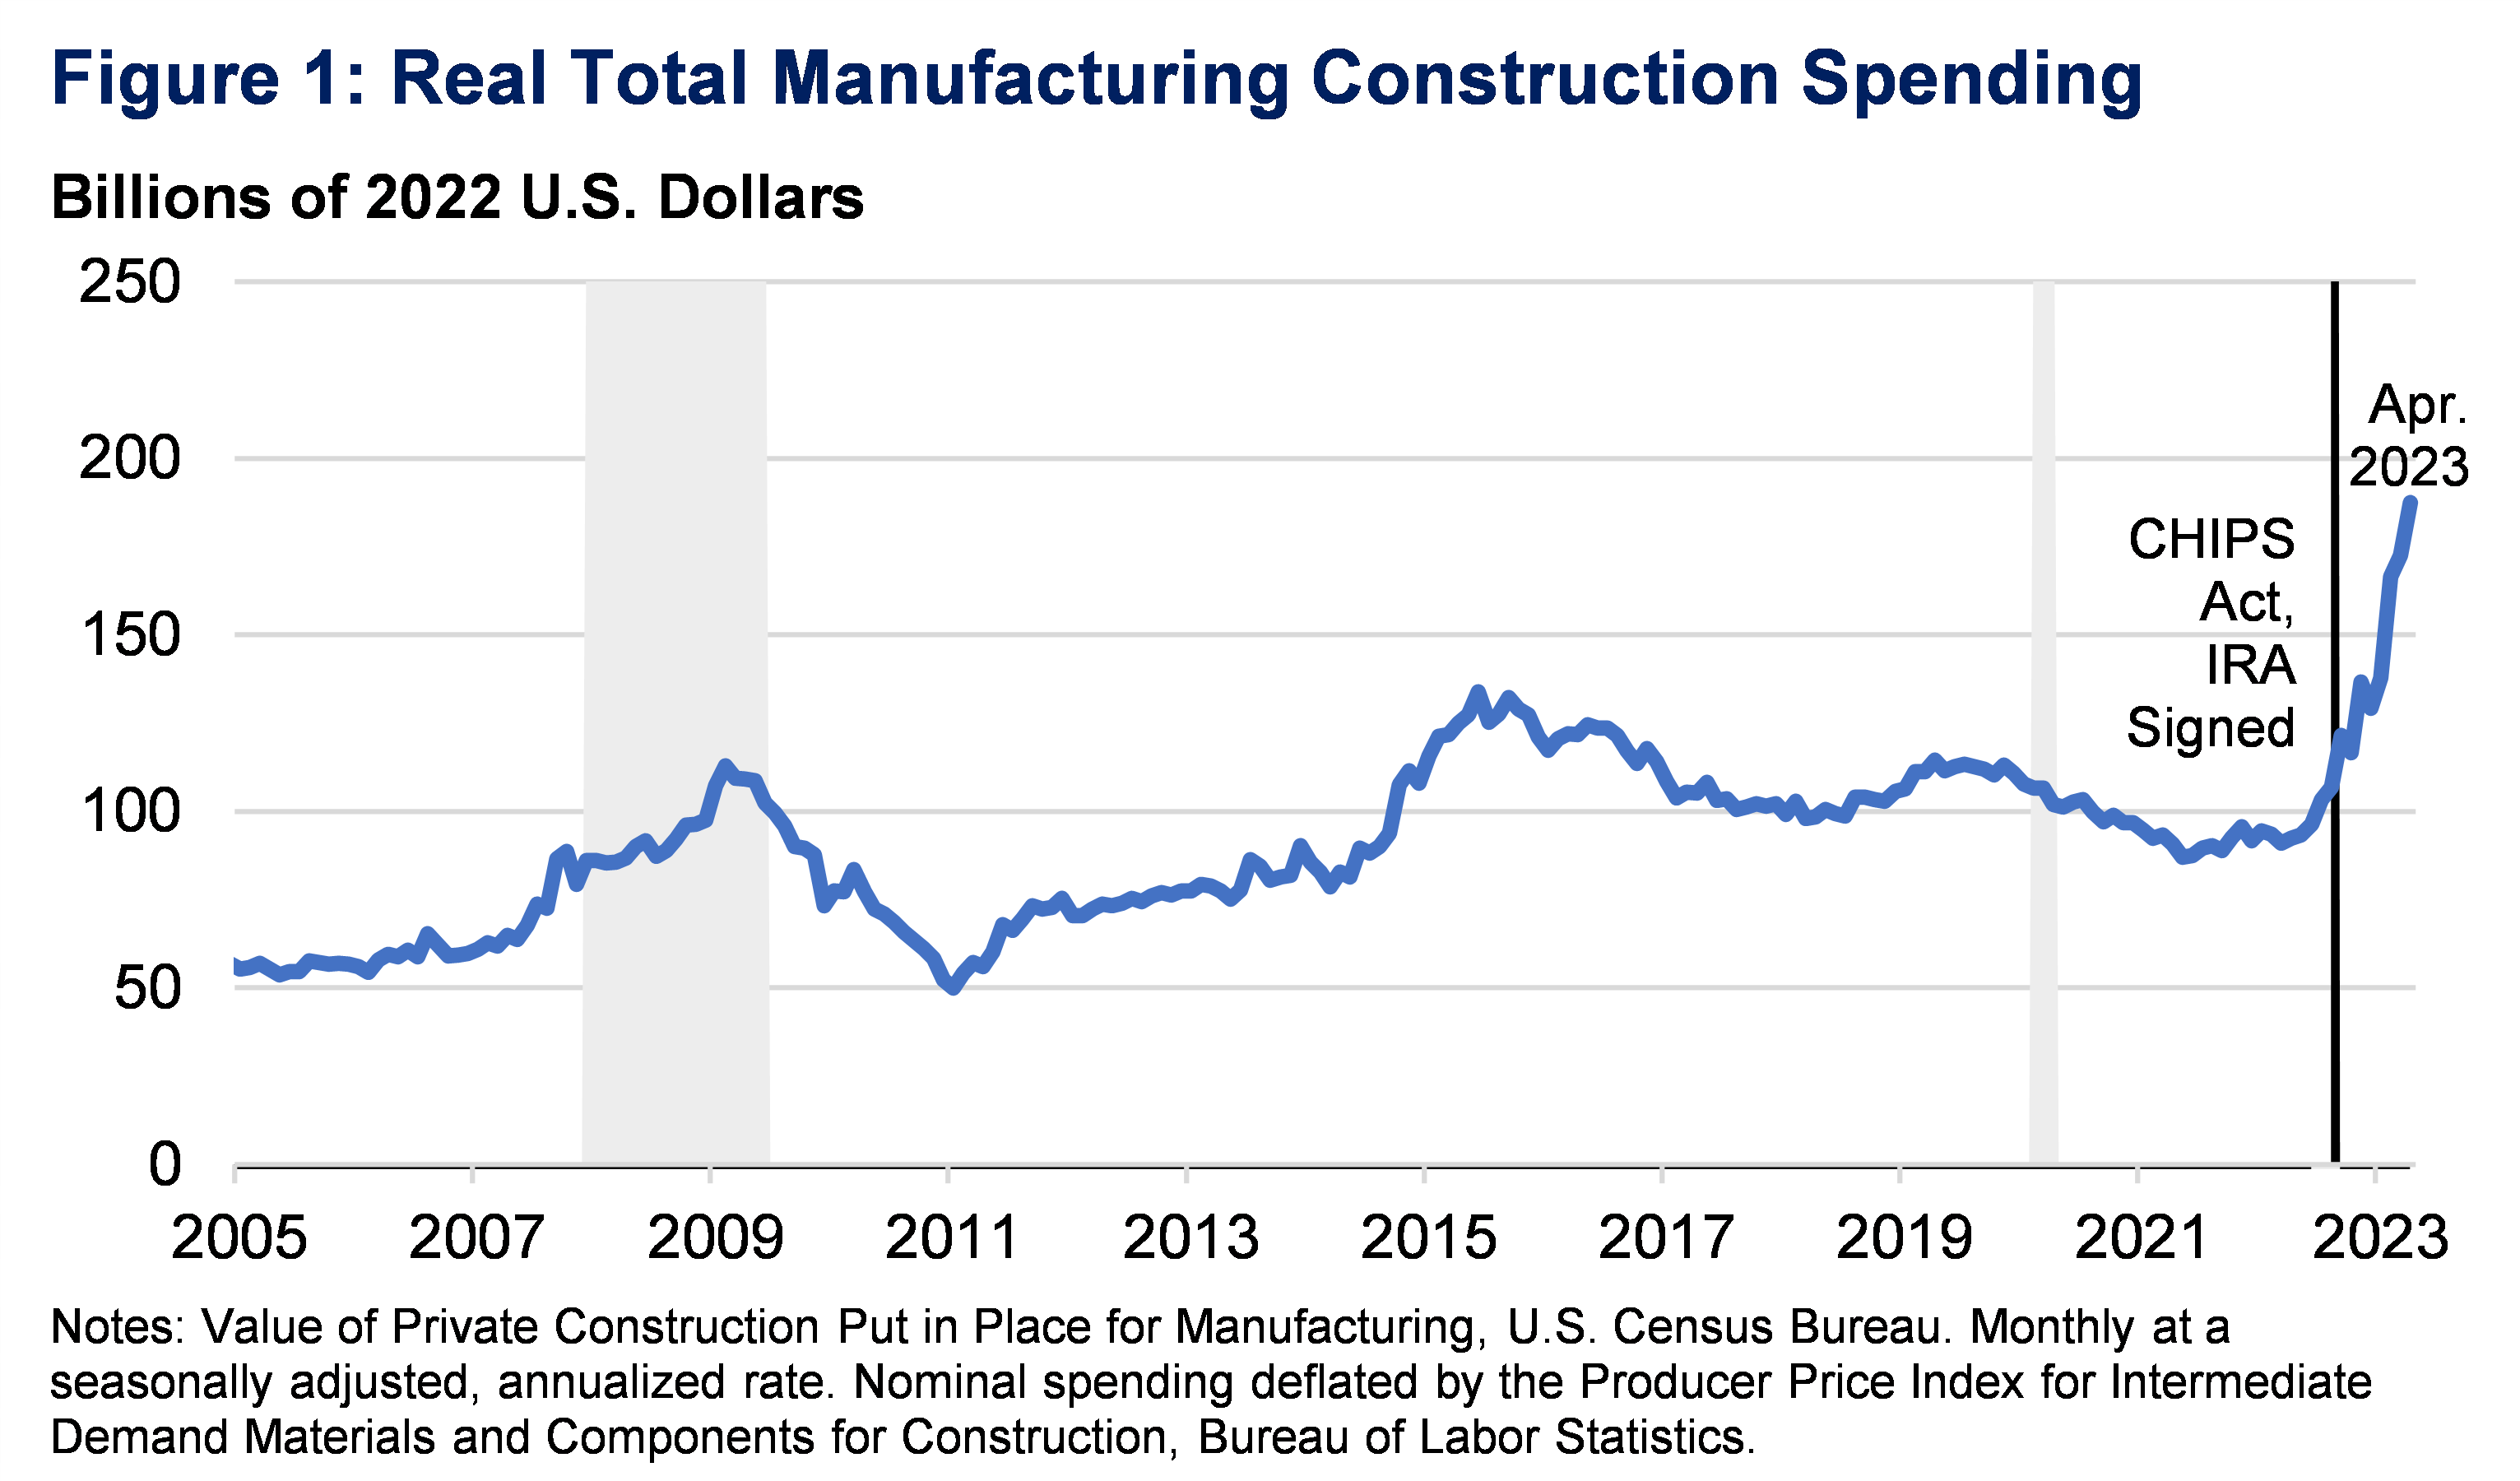
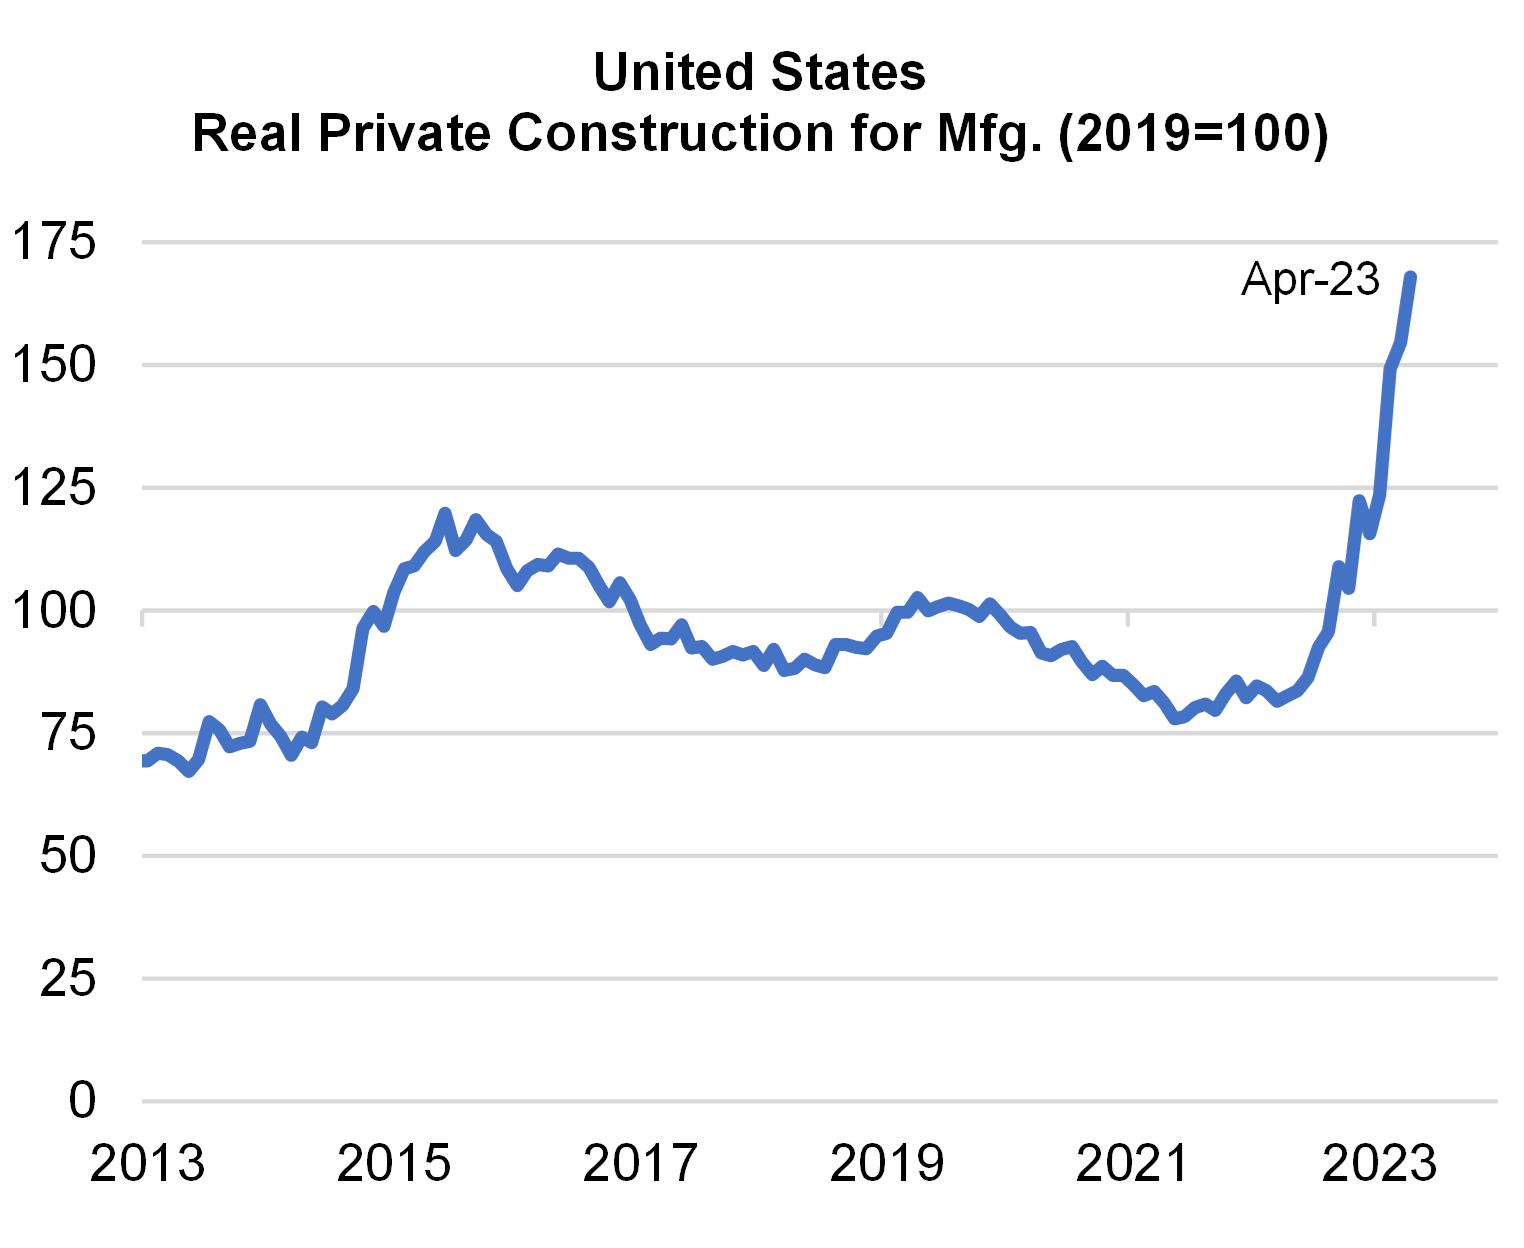
The United States has experienced a striking surge in construction spending for manufacturing facilities. Real manufacturing construction spending has doubled since the end of 2021 (Figure 1).[1] The surge comes in a supportive policy environment for manufacturing construction: the Infrastructure Investment and Jobs Act (IIJA), Inflation Reduction Act (IRA), and CHIPS Act each provided direct funding and tax incentives for public and private manufacturing construction.
We explore the surge along three key dimensions:
- The boom is principally driven by construction for computer, electronic, and electrical manufacturing—a relatively small share of manufacturing construction over the past few decades, but now a dominant component.
- Manufacturing construction is one element of a broader increase in U.S. non-residential construction spending, alongside new building for public and private infrastructure following the IIJA. The manufacturing surge has not crowded out other types of construction spending, which generally continue to strengthen.
- Finally, we put the trend in international context. While it can be difficult to compare such granular data across countries, the surge appears to be uniquely American—not mirrored in other advanced economies.
DECOMPOSING THE SURGE
Within real construction spending on manufacturing, most of the growth has been driven by computer, electronics, and electrical manufacturing. Since the beginning of 2022, real spending on construction for that specific type of manufacturing has nearly quadrupled (Figure 2).
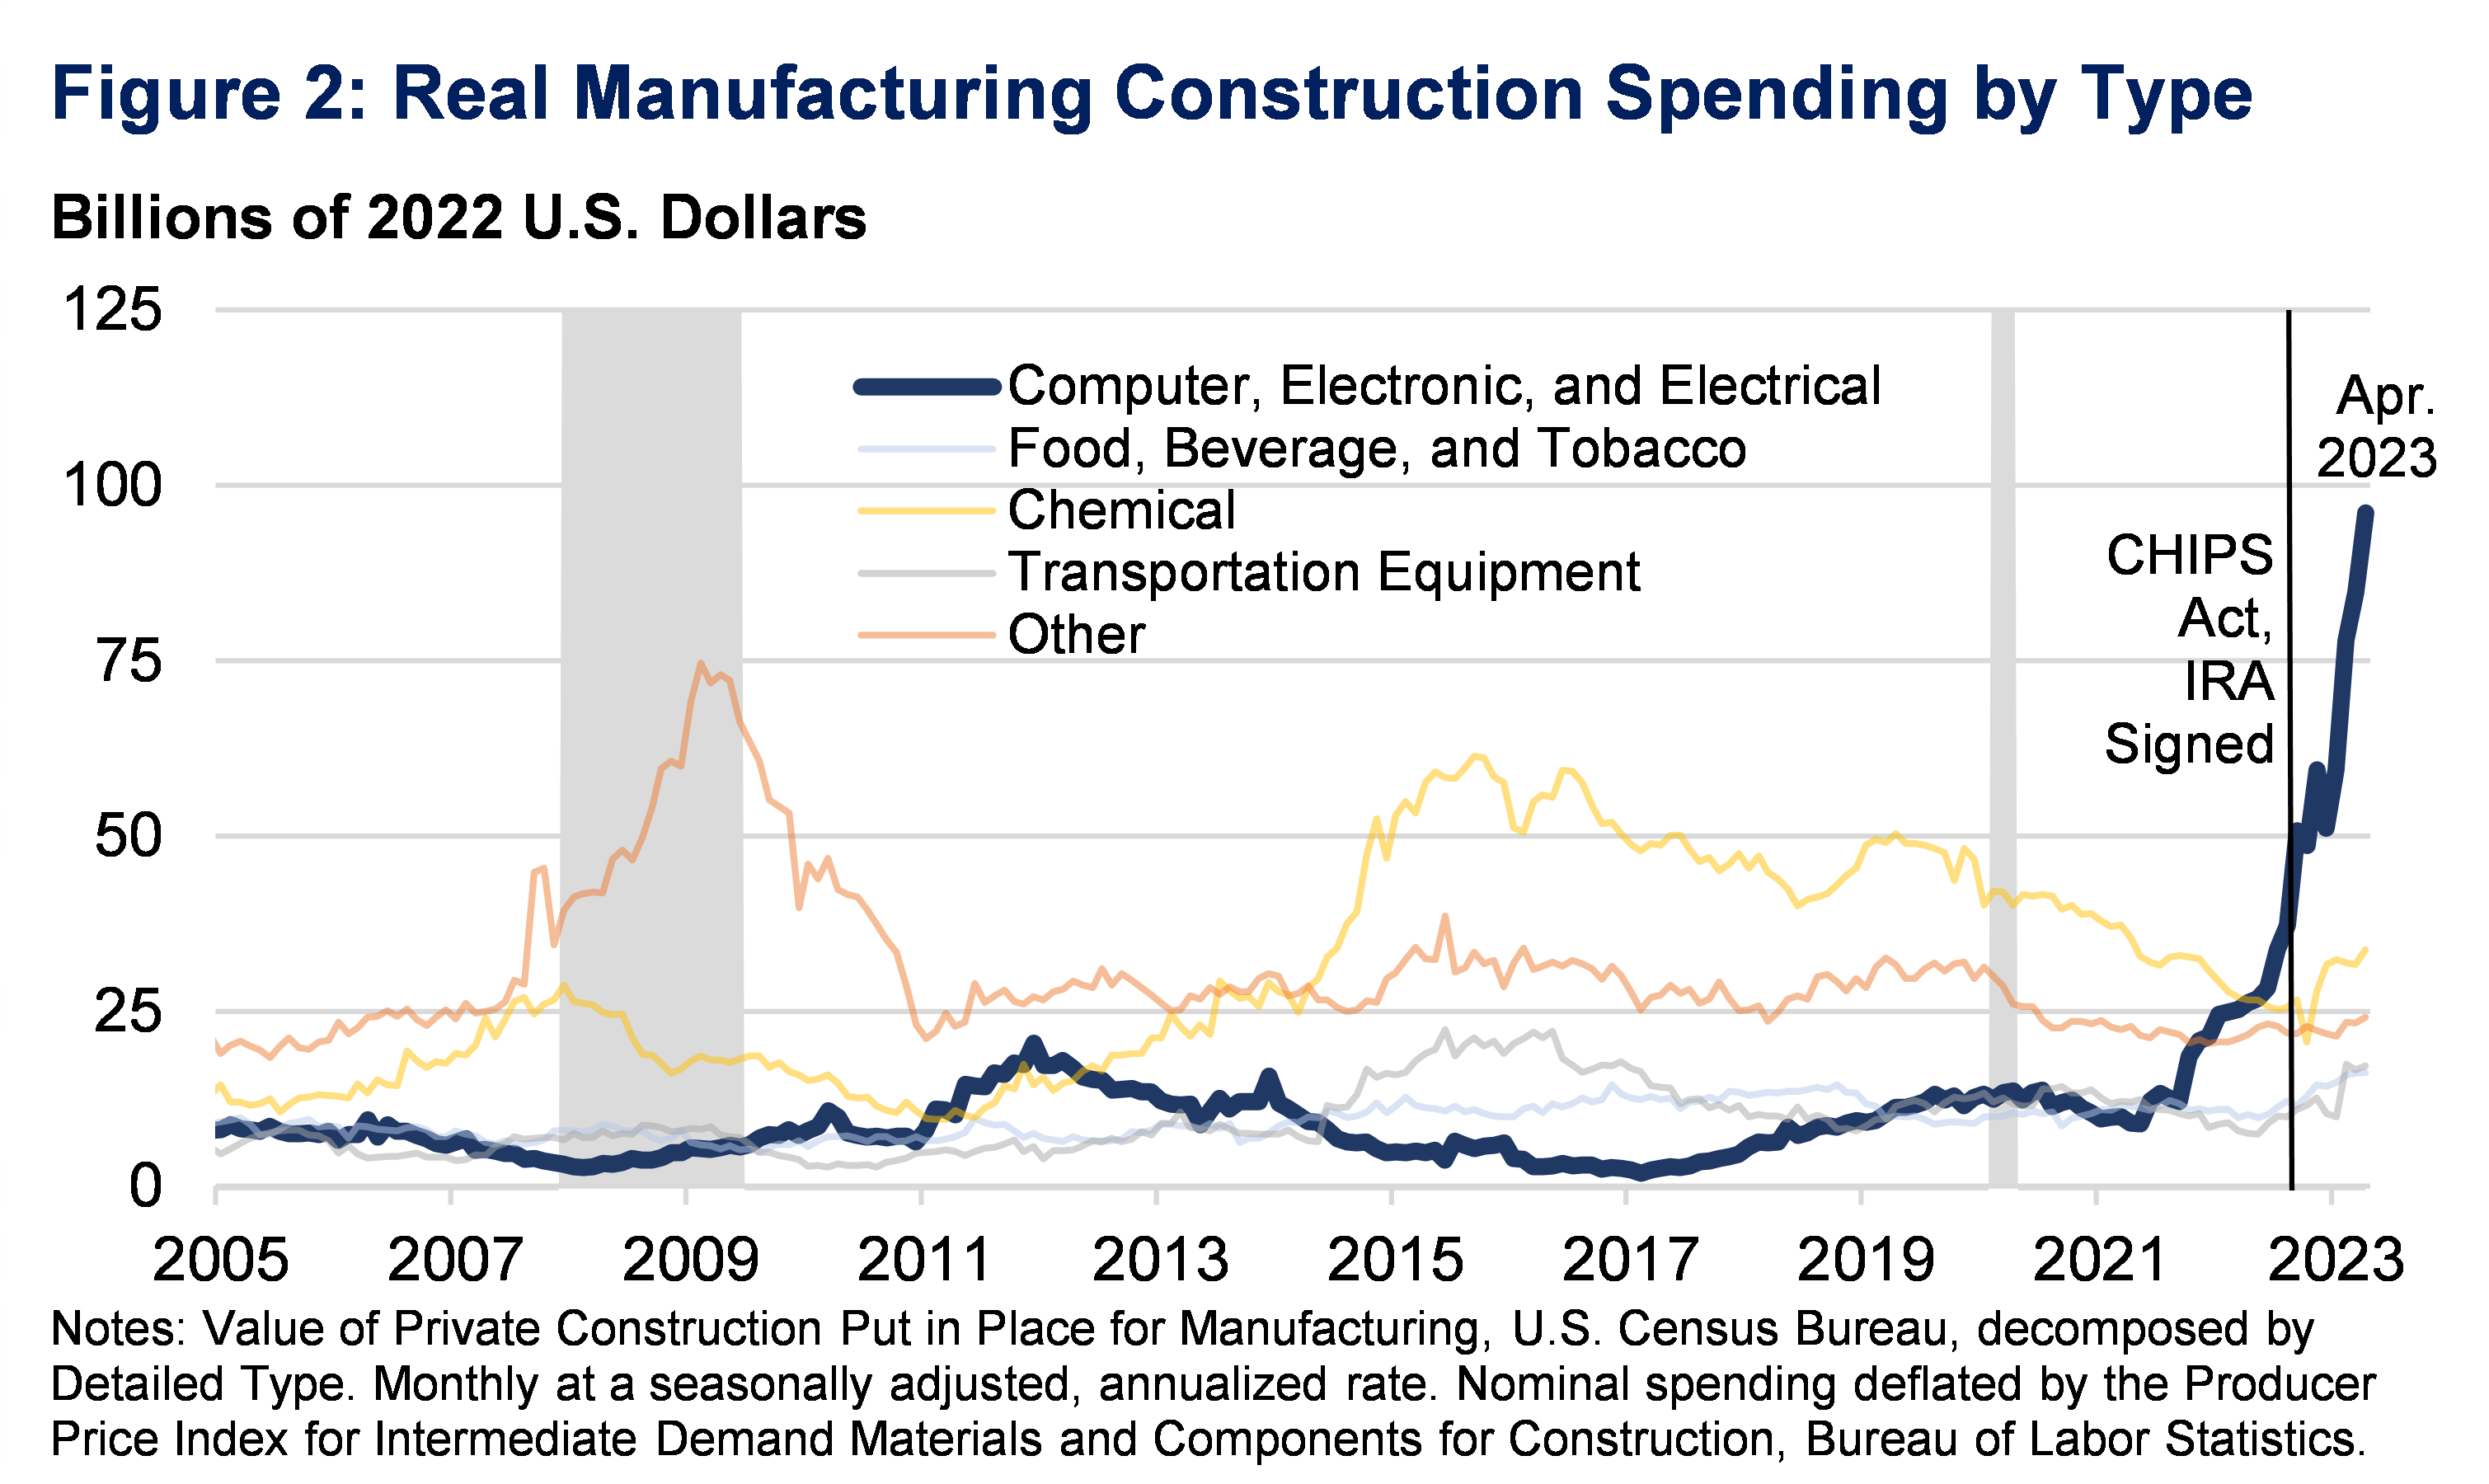
The adjustment for price increases is particularly important here. Construction costs have risen quickly in recent years, and therefore nominal spending growth should not be misconstrued as increased physical construction. But by considering deflated measures as we do here, it is clear that the surge is a real one (see Appendix for a more detailed discussion of our choice of deflator).
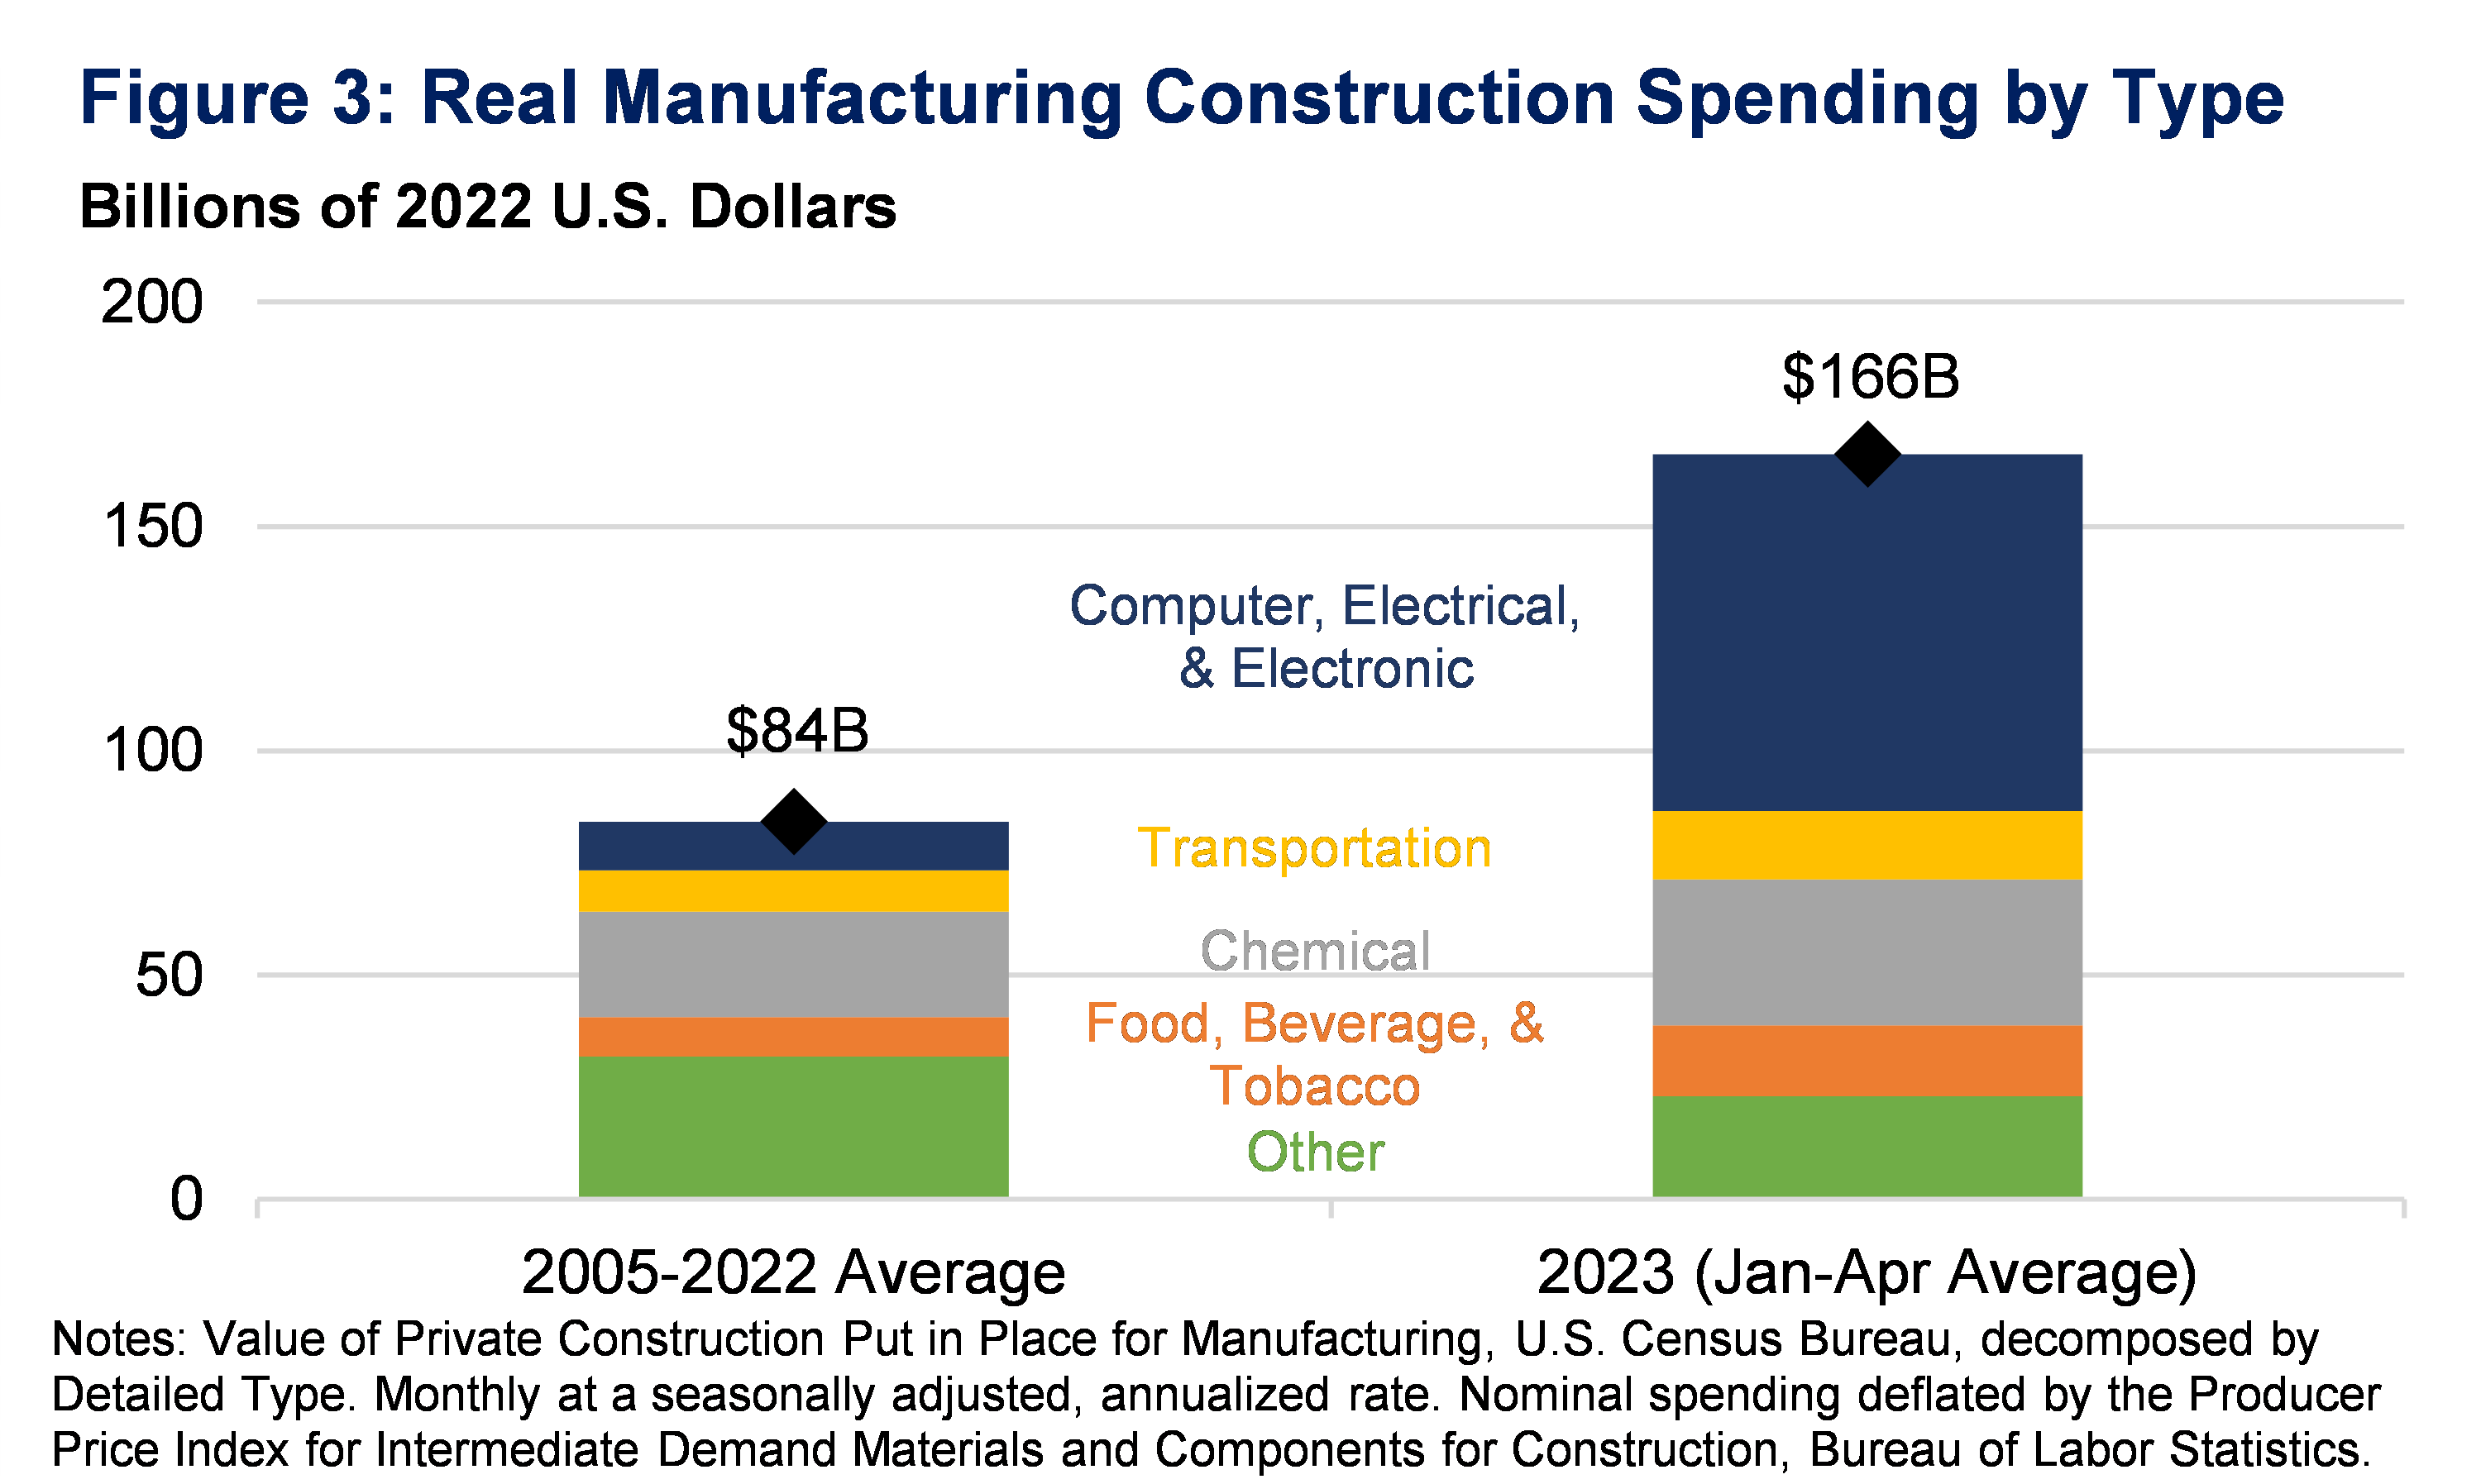
Today, the computer/electronic segment is the dominant component of U.S. manufacturing construction. Importantly, the boom in this segment has not been offset by reduced spending on other manufacturing construction segments, which are largely consistent with long-term levels (Figure 3). In fact, construction for chemical, transportation, and food/beverage manufacturing is also up from 2022, albeit much less than the computer/electronic sector.
This rise in the spending began in the months before the CHIPS Act passed, as many factors beyond policy contribute to construction spending. Still, the legislation has played a critical part in continuing and expanding this trend. In particular, private sector analysts have recognized the connection between the growth in construction for electronics manufacturing and the CHIPS Act. Bank of America notes this rise came “potentially on the back of ongoing construction of semiconductor factories as part of the CHIPS Act.” According to Deutsche Bank Research, 18 new chipmaking facilities will have started construction between 2021 and 2023. The Semiconductor Industry Association reports that over 50 new semiconductor ecosystem projects have been announced in the wake of the CHIPS Act.
The macroeconomic situation, policy implementation, and a range of other conditions will continue to shape construction manufacturing spending in the months and years to come. While today’s striking trend may cool, the CHIPS Act has fostered an ongoing opportunity for investment in this sector.
BROADER U.S. NON-RESIDENTIAL CONSTRUCTION SPENDING
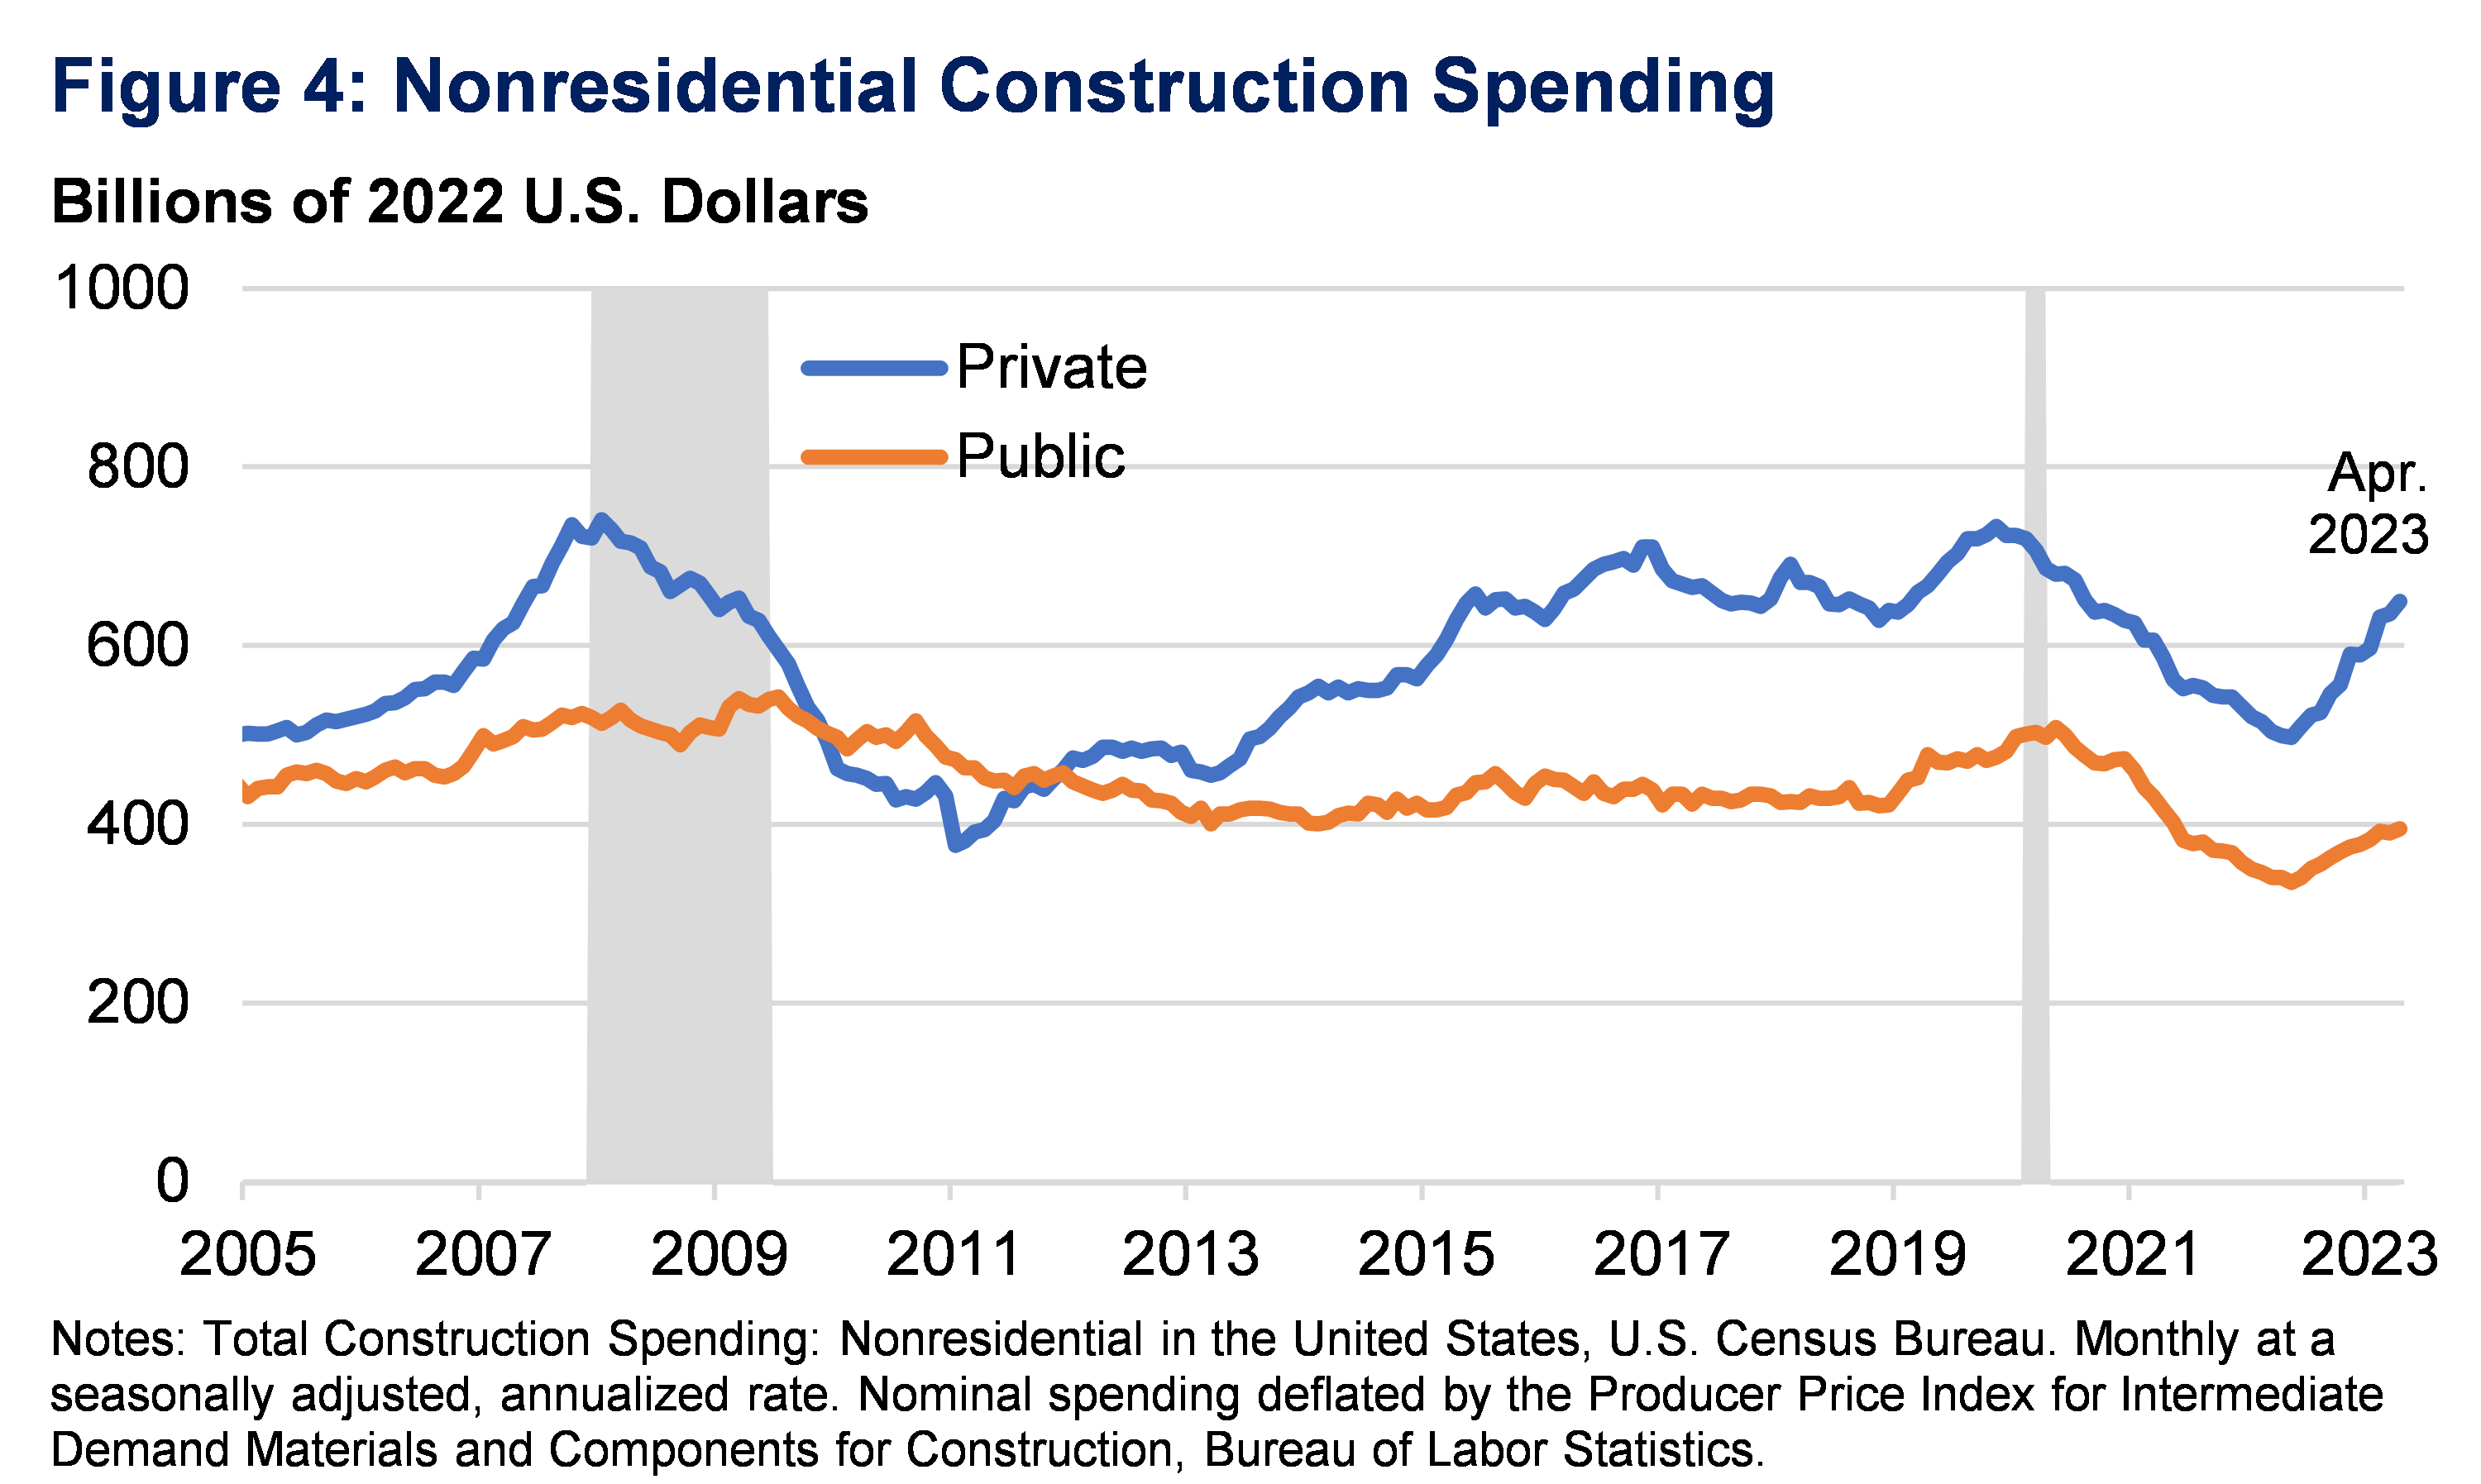
While manufacturing is the most eye-popping component of construction spending, overall real nonresidential construction spending has increased by about 15 percent from November 2021, when the President signed the IIJA, to April 2023. Real public spending, which increased by 7 percent, did not crowd out real private spending, which increased by nearly 20 percent (Figure 4). Moreover, as more IIJA projects come online and break ground, more public and private dollars will go toward our public infrastructure.
Under the hood, specific components of construction spending, beyond manufacturing, have also had substantial increases driven by recent legislation. The IIJA authorized the federal government to distribute new funds to state and local governments for infrastructure needs tied to roads, bridges, public transit, water, and broadband. That funding has started translating to spending.
Since the bill’s passage, construction spending on these areas has outpaced total construction spending. For example, total construction spending has increased about 4 percent, while public construction spending on the water supply has increased by over 20 percent (Figure 5). The IIJA delivered more than $50 billion to the EPA to improve the nation’s drinking water, wastewater, and stormwater infrastructure. Public spending on highways and streets has also increased by about 13 percent, as the IIJA funds roads, bridges, and major projects with over $110 billion over five years.
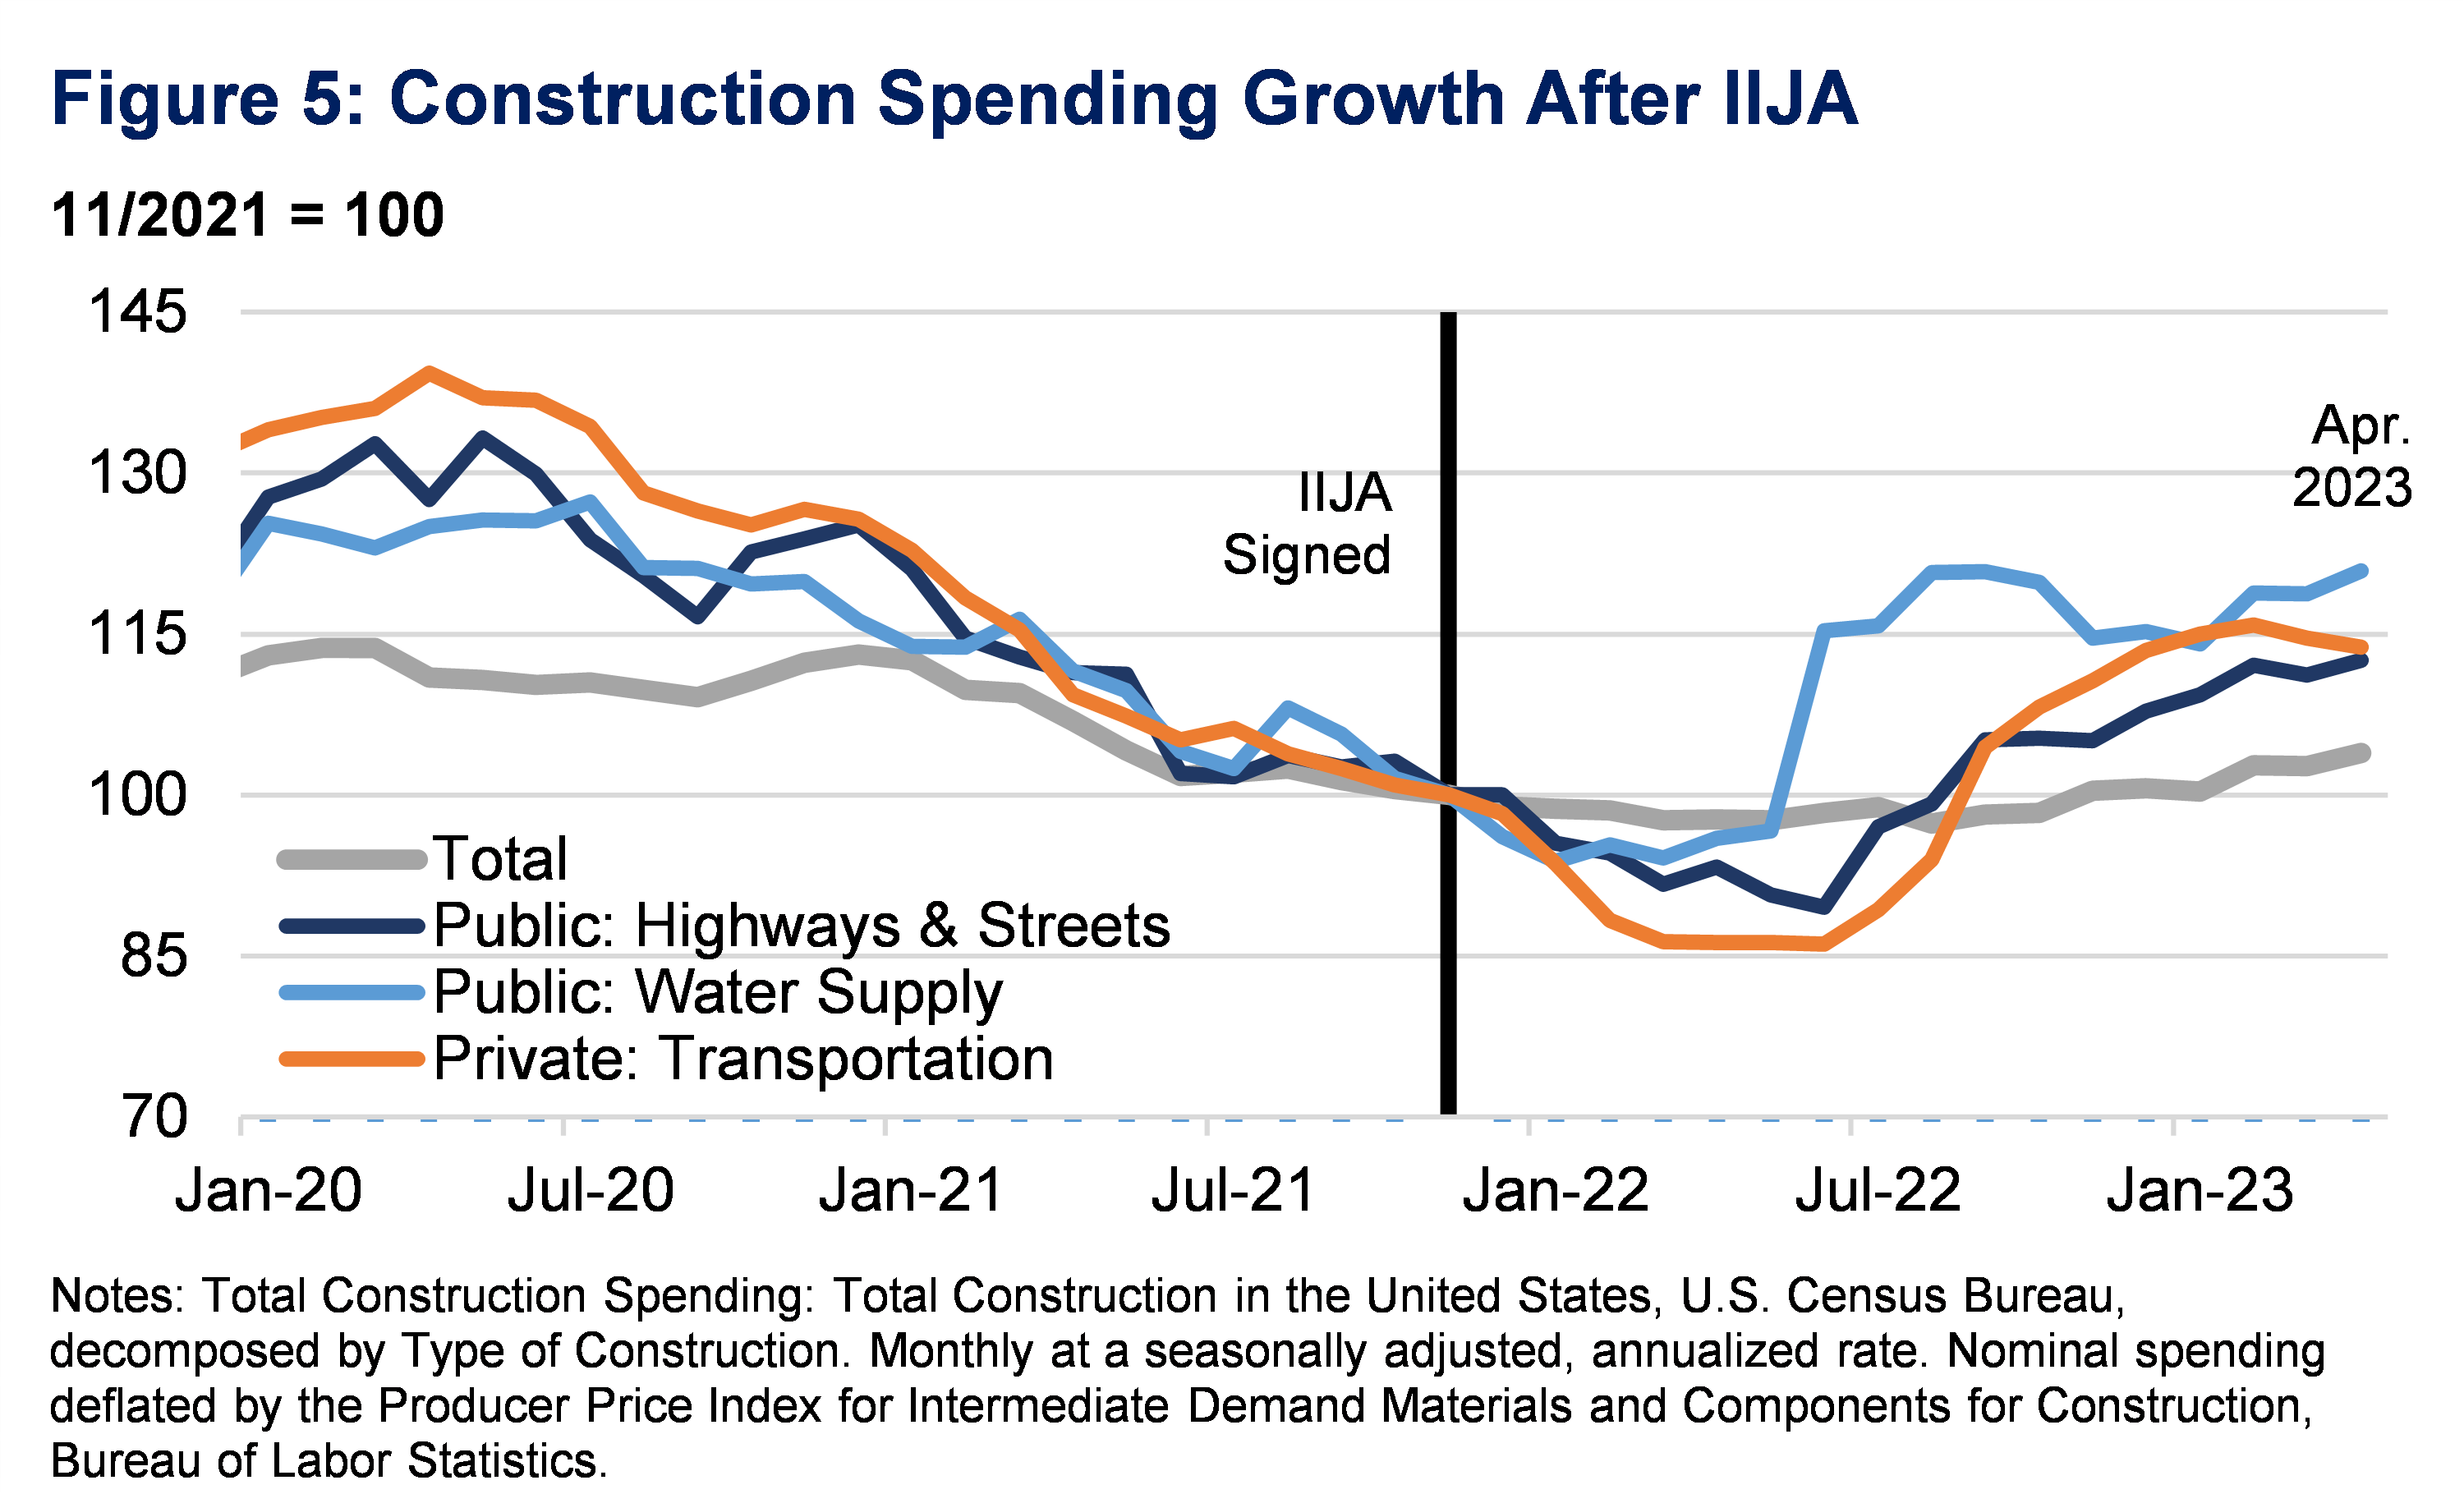
Again, the legislation increased public spending but has not crowded out private spending. Real private spending on transportation construction has grown by nearly 14 percent since the President signed the IIJA. The legislation increased the available Private Activity Bonds (PABs) authority from $15 to $30 billion. PABs, allocated by the Secretary of Transportation, incentivize private sector investment in U.S. transportation infrastructure. Across over 40 projects, the Department of Transportation has approved nearly $17 billion and allocated an additional $2.8 billion in PABs.
Such investments harness government resources to increase productive capacity—a central goal of Secretary Yellen’s Modern Supply-Side Economics policy framework. Private manufacturing for semiconductors, with funding from the CHIPS Act, expand the U.S. economy’s footprint in a sector vital for today and tomorrow’s technologies. Increased public expenditure on our infrastructure from the IIJA enables a better functioning, more resilient economy. Tax incentives from the IRA address the historically overlooked market failure of climate change, ushering in a green energy transition that steers the country toward sustainable growth. Each of these projects addresses market failures to increase inputs to production which fuels long-run growth.
INTERNATIONAL CONTEXT
Finally, we explore international data and find that the same surge in manufacturing construction is not apparent in other advanced economies. No harmonized data series provides an exact comparison to the United States, but comparable data indicators help unveil the relevant trends.
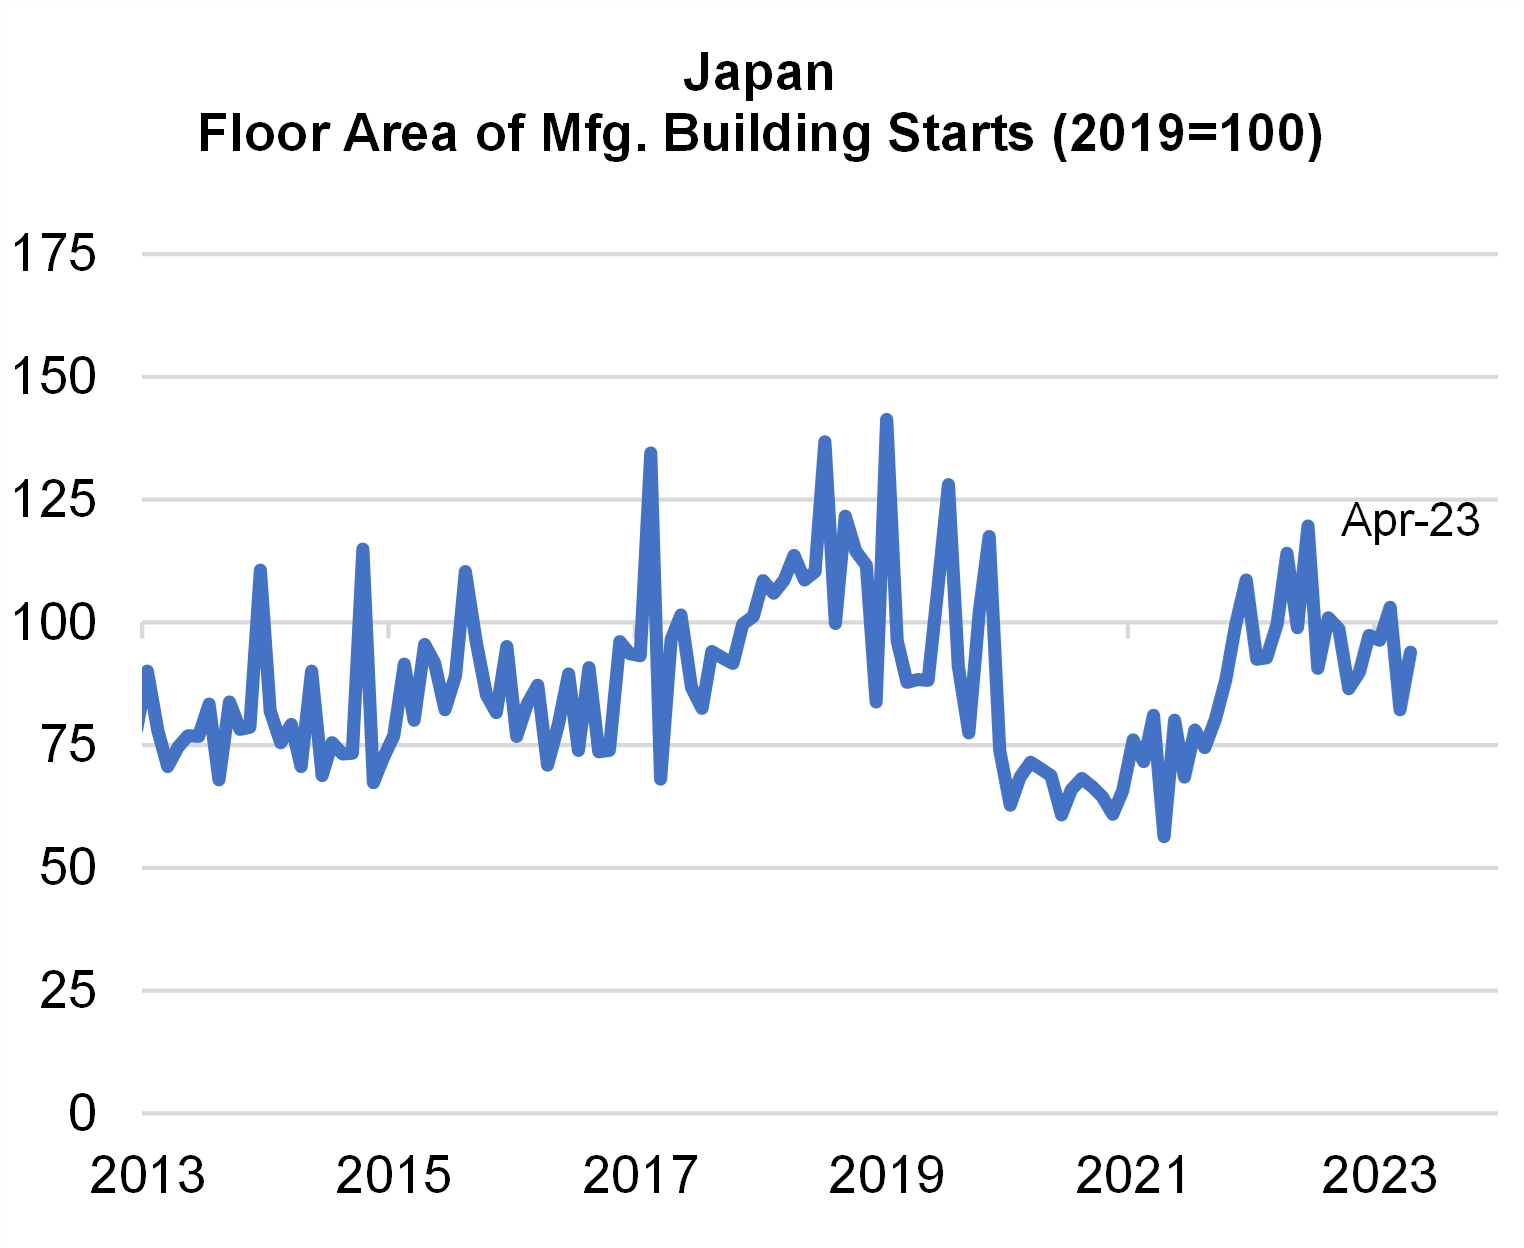
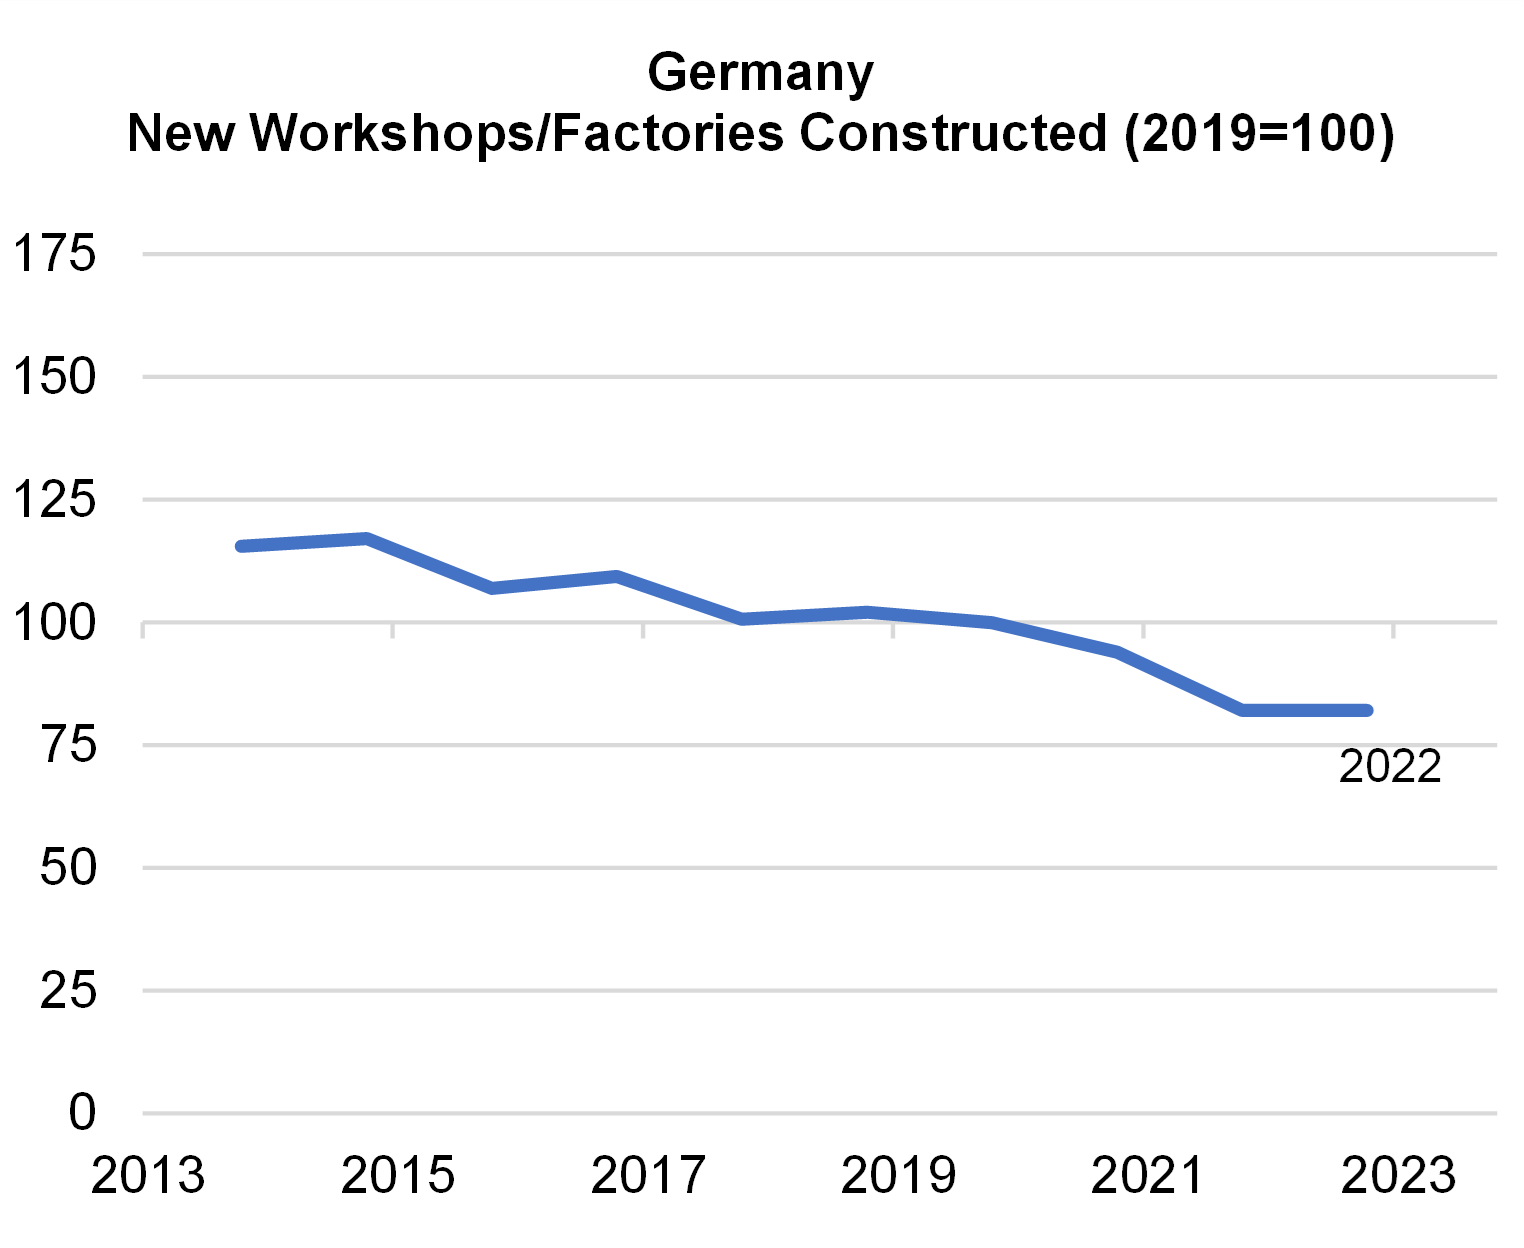
Other advanced economies have not experienced similar increases, according to roughly analogous data sets measuring some concept of real construction for manufacturing purposes (Figure 6). Japan has had seen increases in the floor area of new manufacturing over the past year, but remains below pre-pandemic levels. Germany’s real new construction spending on factory and workshop buildings has remained relatively stable over the past decade. Notably, the United Kingdom and Australia did see meaningful increases in real industrial construction in 2022, rising about 40 percent from 2021 levels. But those series have leveled off since then, over the period in which U.S. manufacturing construction has nearly doubled.
Figure 6: International Context for Manufacturing Construction Spending
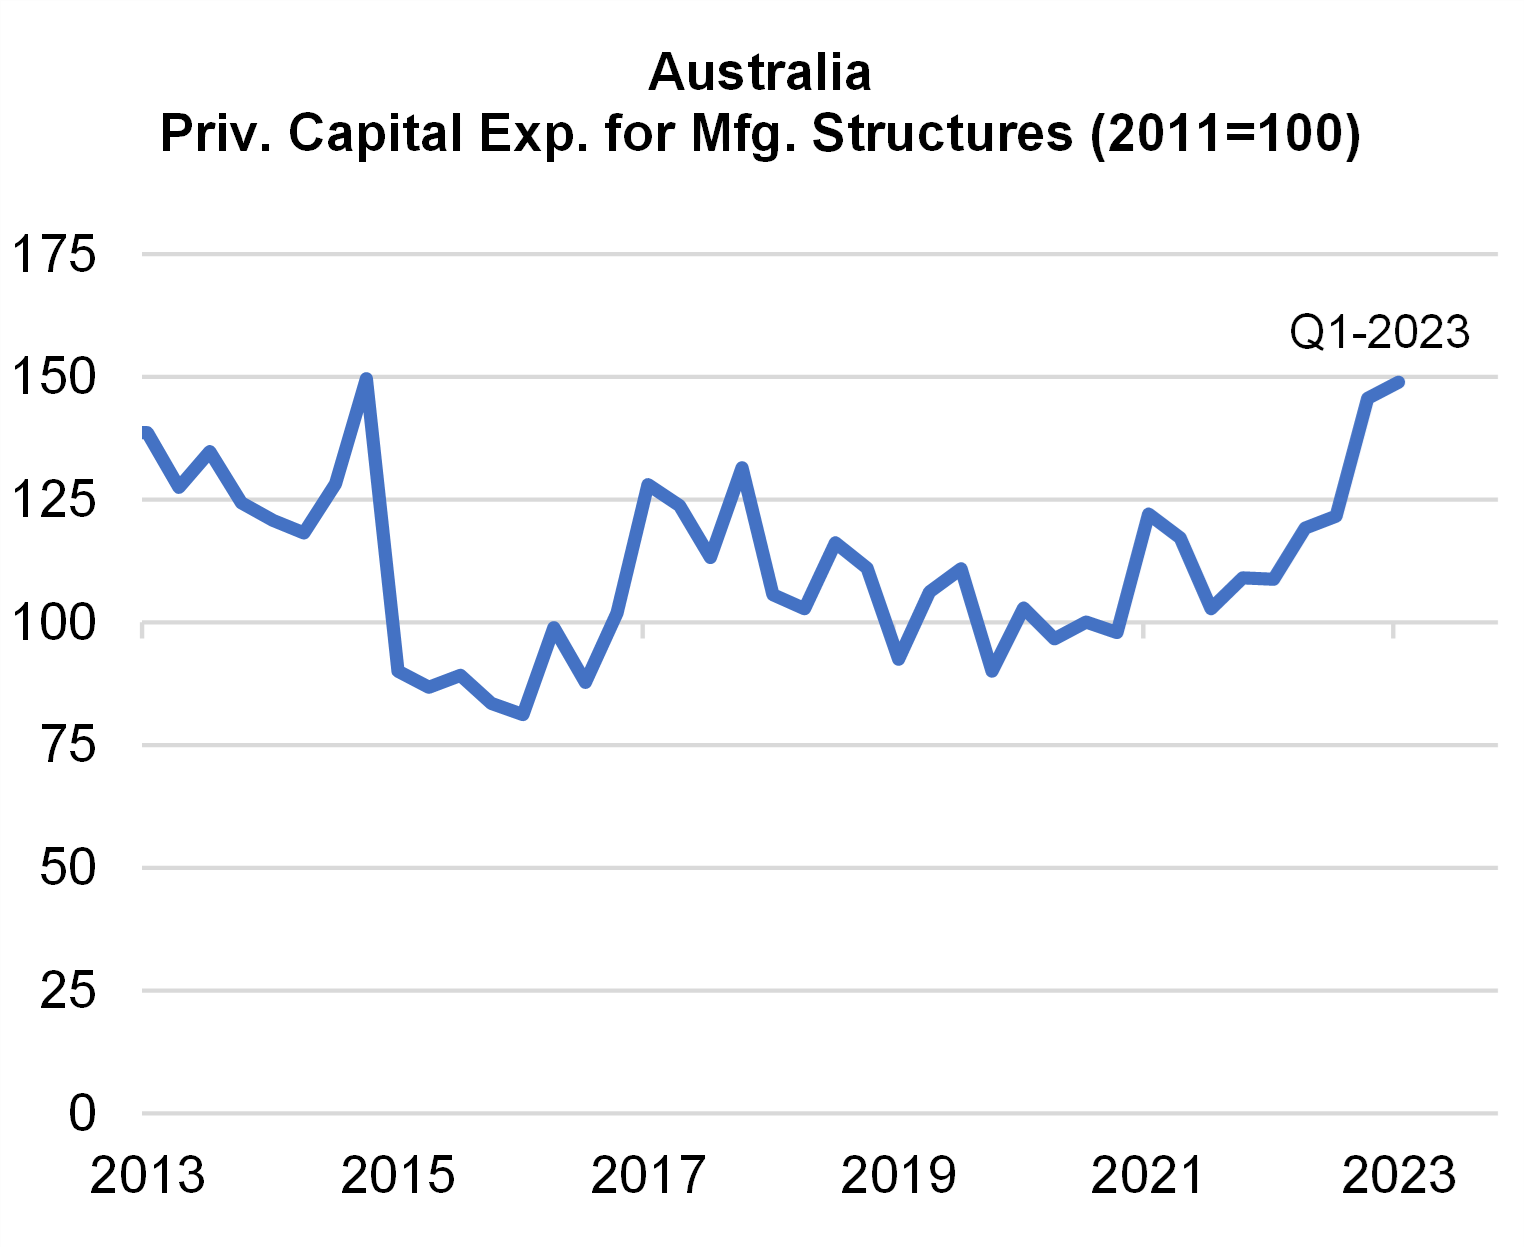
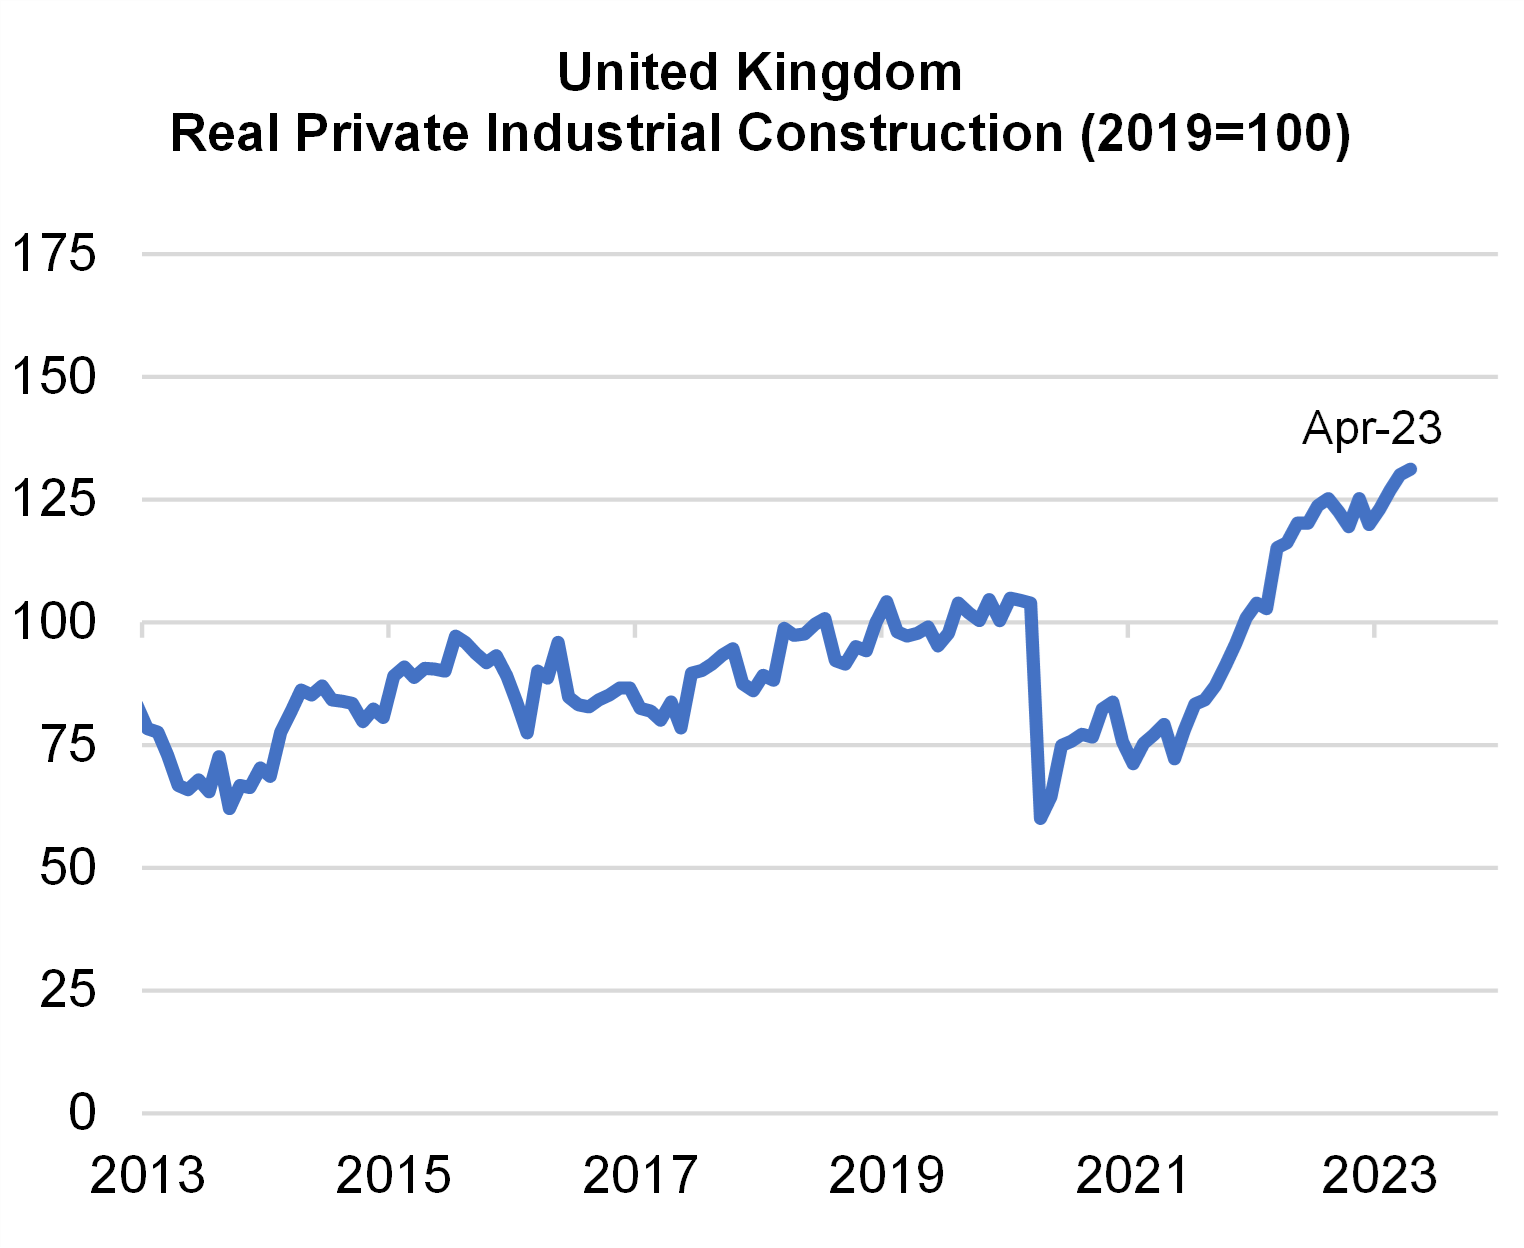
Notes: U.S. Value of Private Construction Put in Place for Manufacturing, U.S. Census Bureau. Monthly at a seasonally adjusted, annualized rate. Nominal spending deflated by the Producer Price Index for Intermediate Demand Materials and Components for Construction, Bureau of Labor Statistics. United Kingdom Construction Output: Other New Work, Private Industrial, Office for National Statistics. Annual millions of chained 2019 Pounds. Japan Building Starts, Floor Area: Manufacturing, The Ministry of Land, Infrastructure and Transport. Annual millions of square meters, seasonally-adjusted by authors. Germany New Construction: Factory and Workshop Buildings: Estimated Costs, Federal Statistical Office. Annual millions of chained 2011 Euros. Australia Private New Capital Expenditure: Manufacturing: Buildings/Structures, Australian Bureau of Statistics. Annual millions of chained FY 2021 Australian Dollars.
CONCLUSION
The boom in U.S. manufacturing construction is a real one: driven by the Administration’s policy focus and led by technology manufacturing, while leaving room for broader construction to continue growing. While many factors are at work on this trend, this kind of progress is central to President Biden’s economic agenda and Secretary Yellen’s approach to Modern Supply-Side Economics.
Appendix on Choice of Deflator
Nominal construction spending has risen consistently since the onset of the pandemic, but much of this increase is attributable to a sharp rise in the increase of both labor and materials costs in constructions (Figure 7). This note deflates seasonally adjusted construction spending using the Producer Price Index (PPI) series: “Intermediate Demand Materials and Components for Construction.”
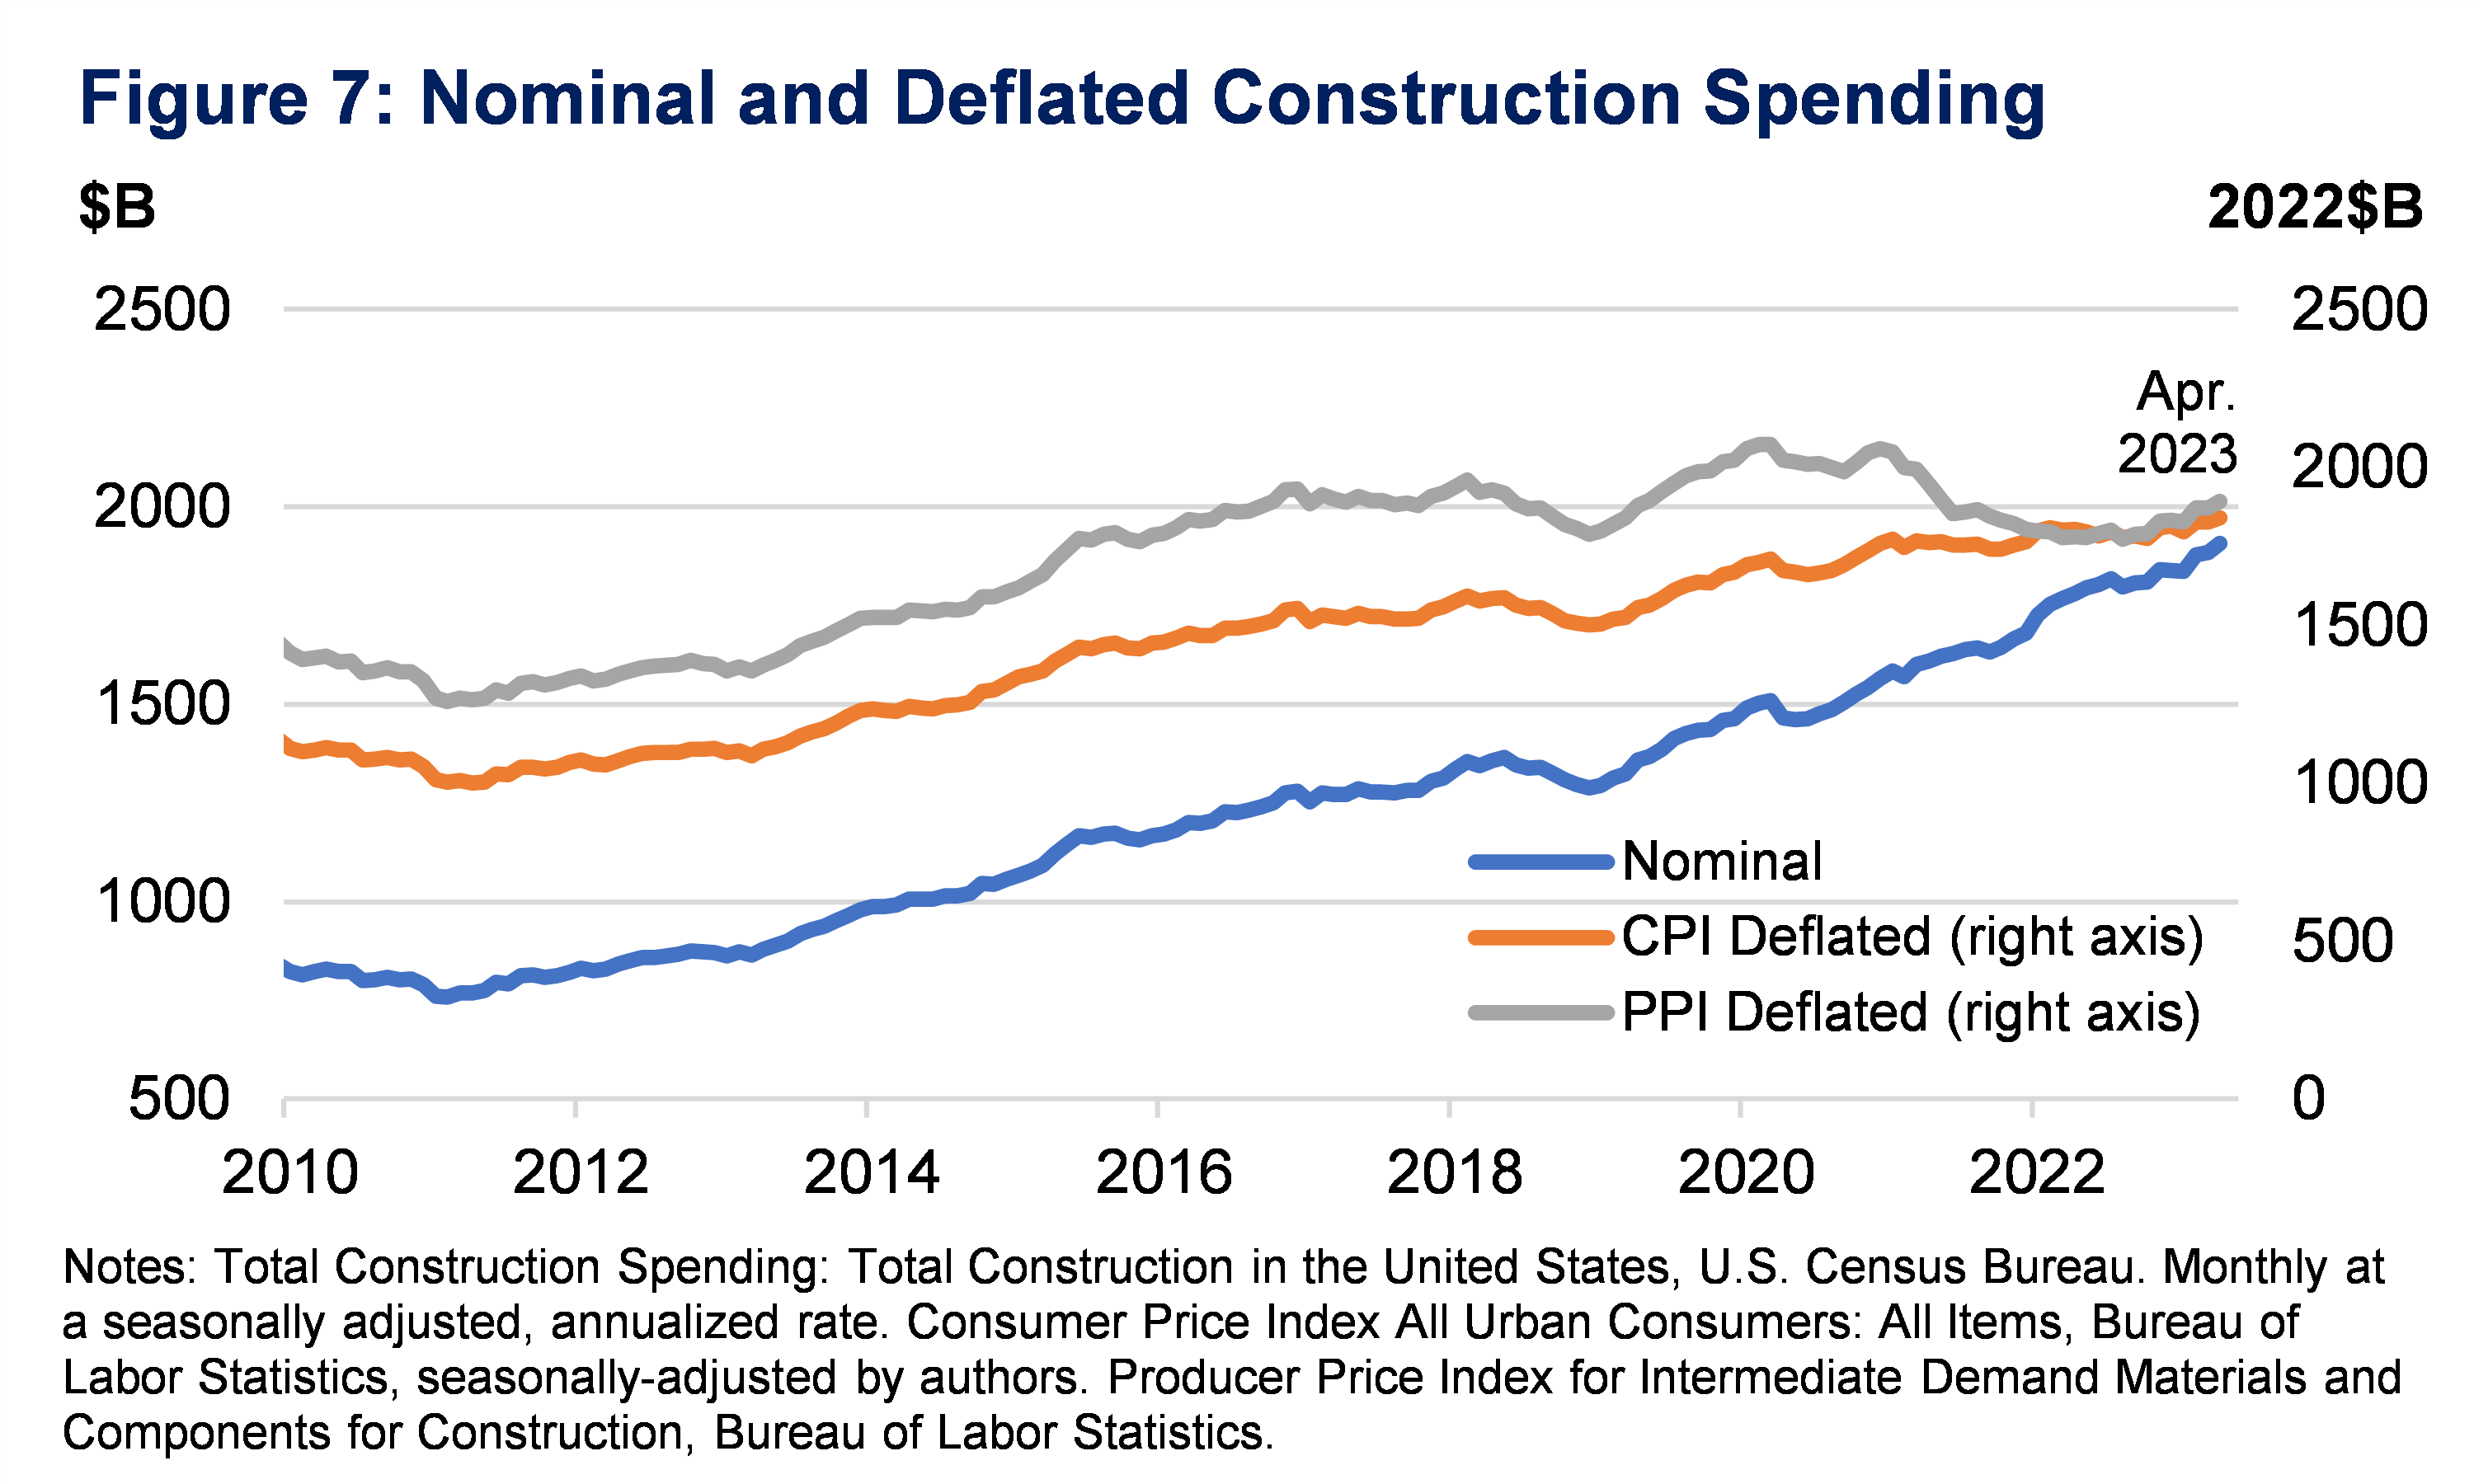
Notably, this series does not account for changes in labor costs for construction. Other price indices, such as the PPI series for “New Industrial Building Construction,” account for labor costs. However, we use the materials and components series because its data extend further back, enabling a longer time series analysis. In addition, this series generally tracks other construction cost price indices (Figure 8).
Others have used a broad Consumer Price Index measure when discussing construction spending. Deflating spending by a broad CPI measure, though, masks the specific change in the cost of construction (Figure 8). In addition, the use of a construction-specific price index, rather than the CPI, stays true to the general trend of higher-than-average price increases in this industry.

[1] For our principal measure of nominal manufacturing construction spending, we rely on the U.S. Census Bureau’s “Construction Put in Place” dataset. This series has grown faster in recent quarters than the non-residential fixed investment in manufacturing structures in the National Income & Product Accounts. The Census data is used to revise the NIPA data, however, which has led most researchers to focus on the Census series. See, e.g., FEDS Note “Nonresidential construction spending is likely not as weak as it seems” (2023).